Wireshark is a powerful tool for network security analysts working in sensitive or cleared environments. It provides deep visibility into network traffic, enabling detection of threats like lateral movement, data exfiltration, and command-and-control communications. By analyzing packets at a granular level, Wireshark helps professionals identify issues that traditional tools might miss.
Key takeaways:
- Setup and Security: Always avoid running Wireshark with root/Administrator privileges to protect system integrity. Use tools like
tcpdumpordumpcapfor safer packet collection and analyze data on isolated systems. - Filters: Use capture filters to collect specific traffic and display filters for post-capture analysis. Examples include
host 192.168.1.1(capture traffic from a specific host) andtcp.flags.syn == 1(display connection attempts). - Troubleshooting: Wireshark can diagnose network issues like ARP conflicts, DHCP failures, and ICMP tunneling. It also provides insights into encrypted traffic using TLS metadata.
- Advanced Features: Tools like the Expert Information panel and TShark command-line utility streamline analysis and automate workflows.
Wireshark’s capabilities, when paired with proper techniques, empower analysts to efficiently detect and resolve network issues while maintaining strict security protocols.
Wireshark Full Course 🦈| Wireshark Tutorial Beginner to Advance 🔆 Wireshark 2023
sbb-itb-bf7aa6b
Setting Up Wireshark in Secure Environments
When using Wireshark in sensitive environments, maintaining a secure setup is critical to protect system integrity while analyzing network traffic. With over 2.5 million lines of ANSI C dissector code, Wireshark processes external data and could be a target for exploits. For this reason, never run Wireshark with root or Administrator privileges [4]. Security experts caution that vulnerabilities in dissector code could allow attackers to take full control of a system [4].
Installing Wireshark Safely
To ensure a secure installation, it’s best to separate packet capture from analysis. Tools like tcpdump or dumpcap can be used to collect packets on sensitive systems. These files can then be transferred to an isolated machine for analysis [4][3]. This air-gapped approach limits potential damage to the analysis environment, keeping production systems safe.
After installation, confirm the version by running wireshark --version to verify that the latest security updates are applied [6]. On Linux, configure capture permissions without requiring root access. Use the command sudo setcap cap_net_raw,cap_net_admin+eip /usr/bin/dumpcap and add your user to the Wireshark group with sudo usermod -a -G wireshark $USER [5]. For Windows, ensure the Npcap driver is installed to enable access to network interfaces. Enable loopback capture support if you need to analyze internal application traffic [3].
Once installed, the next step is to securely configure network interfaces for capturing traffic.
Configuring Network Interfaces
Before starting any capture, it is essential to obtain explicit authorization. As Mike Chapple from the University of Notre Dame warns, using Wireshark without proper authorization can result in serious legal consequences [8]. After securing permission, open the Capture/Interfaces dialog to select the appropriate interface. This could be a physical Ethernet port (e.g., eth0), a VPN tunnel (e.g., tun0), or the loopback interface (lo) for analyzing local traffic [7][5].
To enhance security, disable network name resolution by navigating to Edit → Preferences → Name Resolution and unchecking "Resolve network names" [6][8]. This prevents Wireshark from making outbound DNS queries, which could inadvertently leak information or violate monitoring protocols. Additionally, apply BPF capture filters (e.g., port 80 or port 443) to focus on specific traffic. This minimizes unnecessary data collection, reduces storage needs, and lowers the risk of capturing unrelated sensitive information [5][9].
Using Wireshark Filters for Efficient Analysis
Wireshark Capture Filters vs Display Filters Comparison Guide
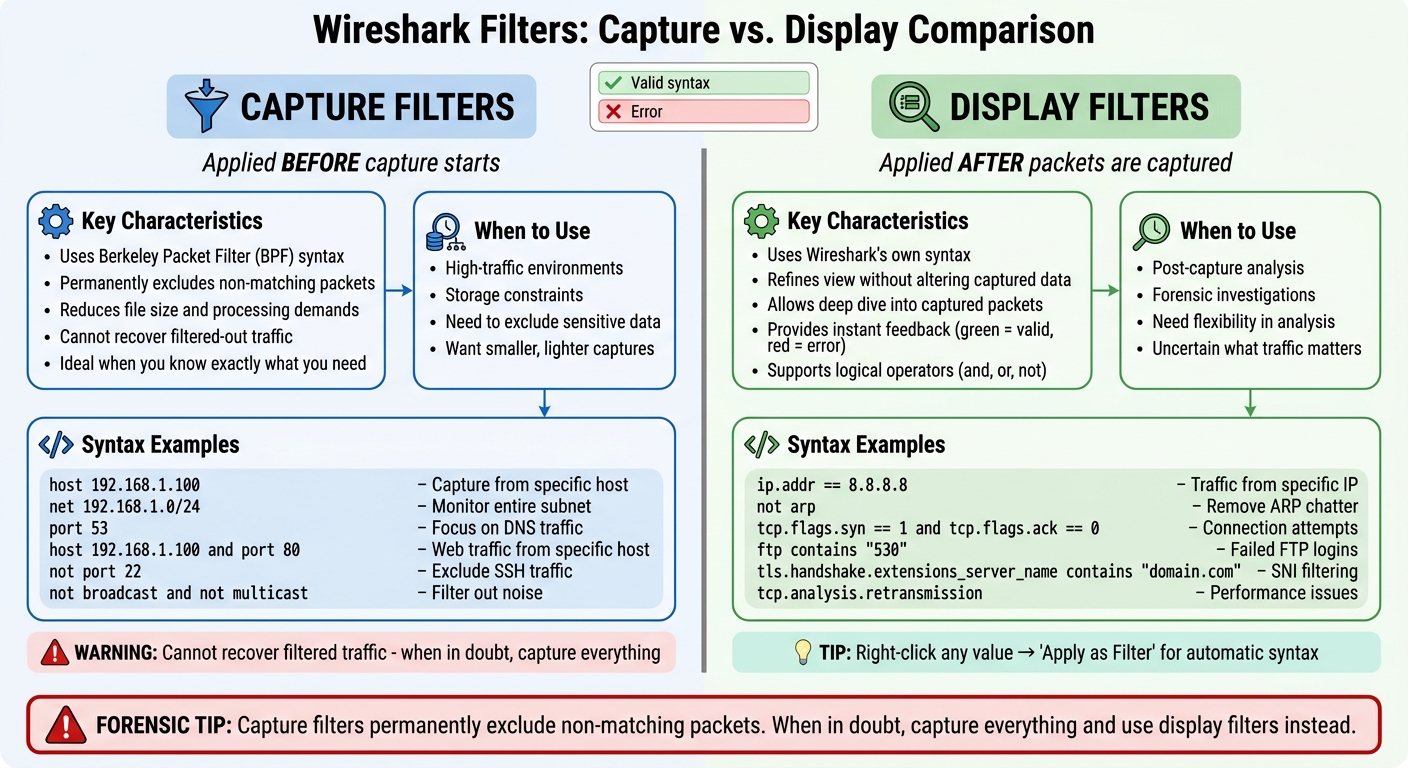
Filtering is what separates meaningful data from an overwhelming flood of packets. In secure setups, capture filters and display filters each play a distinct role. Capture filters, based on Berkeley Packet Filter (BPF) syntax (also used by tcpdump), are applied before starting a capture. They help reduce file size and processing demands by excluding unnecessary traffic upfront [10]. Meanwhile, display filters, which use Wireshark’s own syntax, are applied after packets are captured. This allows you to refine what you see without altering the captured data [11].
Knowing when to use each type is essential. As Code Labs Academy explains, capture filters are ideal "when you know exactly what you need and want a smaller, lighter capture" [11]. However, TheHGTech Security Team issues an important warning:
Capture filters permanently exclude non-matching packets. You cannot recover filtered-out traffic. When in doubt, capture everything and use display filters instead [2].
This distinction is particularly critical in forensic investigations, where the information you need might not become apparent until deeper analysis begins.
Applying Capture Filters
Capture filters are like a gatekeeper, ensuring only the most relevant data is collected. Since they operate at the packet capture level, any traffic that doesn’t match the filter is discarded permanently – it never even reaches your disk [2]. This makes them perfect for high-traffic environments where storage is tight or when sensitive, unrelated data needs to be excluded.
Here are some practical examples of capture filters:
- To capture from a specific host:
host 192.168.1.100 - To monitor traffic from an entire subnet:
net 192.168.1.0/24 - To focus on specific protocols: Use keywords like
tcp,udp, orport 53(for DNS) [10].
You can also combine these with logical operators. For instance:
host 192.168.1.100 and port 80captures only web traffic from that host.not port 22excludes SSH traffic, reducing unnecessary noise [2].
Analysts often use exclusions to filter out irrelevant traffic, like not broadcast and not multicast. You can even block specific ports targeted by worms, such as 135 (RPC), 445 (SMB), or 1433 (MSSQL) [10].
Before starting a capture, always validate your syntax in the "Edit Interface Settings" window. BPF syntax has limitations, and an invalid filter may silently fail or capture nothing [10].
Once the initial capture is complete, display filters can help you zero in on the details.
Using Display Filters for Focused Analysis
Display filters are your tool for diving deep into the data you’ve captured. They allow you to fine-tune your view of the packets without altering the original file. Wireshark’s filter bar provides instant feedback – green indicates valid syntax, while red flags errors [11]. Just remember, display filters use a different syntax than capture filters. For example, to filter traffic from a specific IP, use ip.addr == 8.8.8.8 [11].
Display filters are incredibly flexible and support logical operators:
- Narrow results:
and - Broaden results:
or - Exclude traffic:
not
For instance, not arp removes local address resolution chatter, while tcp.flags.syn == 1 and tcp.flags.ack == 0 isolates connection attempts without acknowledgments – a common sign of port scans [12]. To detect brute-force attacks, you can use ftp contains "530" or ssh contains "Failed" to find repeated login failures [12].
To simplify your workflow, right-click any value in "Packet Details" and select "Apply as Filter" → "Selected." This generates the correct syntax automatically [11]. You can also bookmark your favorite filters using the "+" icon for quick access [12]. When you need to share findings, go to "File > Export Specified Packets" and choose "Displayed" to save only the filtered packets [12].
Even encrypted traffic can reveal useful clues. For example:
- Use
tls.handshake.extensions_server_name contains "domain.com"to identify destination hosts via Server Name Indication (SNI). - Apply
tls.alert_messageto uncover certificate issues or protocol mismatches [11].
For performance troubleshooting, filters like tcp.analysis.retransmission and tcp.analysis.duplicate_ack help distinguish between problems at the application layer and network-level bottlenecks [11].
Analyzing Network Traffic for Problem-Solving
Once you’ve captured and filtered network traffic, it’s time to dive into diagnosing the issues. In high-pressure environments, where connectivity failures, performance drops, or suspicious activities demand immediate answers, tools like Wireshark can turn raw packet data into actionable insights. This shift from "I think" to "I know" is crucial when you’re working with concrete evidence [14].
Key packet indicators can reveal the root cause of problems. For instance, ARP conflicts and DHCP failures have distinct signatures, while performance issues often show up as retransmissions, latency spikes, or flow control problems. Even encrypted traffic leaves behind metadata that can help uncover anomalies. As Soumya K from the DEV Community explains:
In security and operations, the difference between ‘I think’ and ‘I know’ is usually packet evidence [14].
Start with the Expert Information tool (Analyze > Expert Information) in Wireshark. This feature highlights protocol issues like malformed packets, checksum errors, and TCP sequence problems, saving you from sifting through thousands of frames manually [13][14]. It’s an excellent first step before diving deeper into specific protocols or performance metrics.
From there, focus on identifying protocol-specific errors, performance bottlenecks, and anomalies in encrypted traffic.
Troubleshooting Protocol-Specific Issues
Protocol errors often have unique symptoms that can guide your troubleshooting.
- ARP Issues: ARP conflicts are common in secure networks, especially when dealing with gateway instability. If you notice a single IP address (like 192.168.1.1) mapping to multiple MAC addresses in a short period, use
arp.duplicate-address-frameto catch these conflicts quickly [16]. Unsolicited ARP replies might indicate spoofing, and rapid MAC address changes for the same IP could suggest ARP cache poisoning. - DHCP Failures: To diagnose DHCP issues, track the DORA process – Discover, Offer, Request, and Acknowledge. Use
bootp.type == 1for client requests andbootp.type == 2for server replies [15]. If you see repeated Discover messages without Offers, the DHCP server might be unreachable or misconfigured. A "NACK" response often points to IP conflicts or exhausted leases. Wireshark’s BOOTP statistics (Statistics > DHCP) can provide a quick overview of the DHCP process [13][15]. - ICMP Diagnostics: ICMP packets can reveal more than just ping results. Oversized ICMP packets (
icmp && data.len > 100) might indicate covert channels or data exfiltration [2]. Filtering foricmp.type == 3can help identify "Destination Unreachable" errors, which often signal routing or firewall issues. In secure environments, ICMP tunneling could be a method for bypassing security controls, making large ICMP packets worth a closer look [2].
| Protocol/Issue | Display Filter | What It Reveals |
|---|---|---|
| ARP Conflicts | arp.duplicate-address-frame |
IP conflicts or potential spoofing attempts [16] |
| DHCP Failures | bootp.type == 1 / 2 |
Problems in address assignment [15] |
| ICMP Tunneling | icmp && data.len > 100 |
Possible data exfiltration or covert channels [2] |
| DNS Failures | dns.flags.rcode == 3 |
NXDOMAIN errors (domain not found) [16] |
Identifying Performance Bottlenecks
Performance issues often stem from specific patterns in network traffic:
- TCP Retransmissions: Packet loss is a common cause of retransmissions. Use
tcp.analysis.retransmissionto isolate these frames and identify whether the issue is due to congestion or faulty equipment [17][18]. Spikes in retransmissions during specific periods might indicate bandwidth saturation or hardware failures. - Round-Trip Time (RTT): RTT measures how long it takes for a packet to travel to its destination and back. Healthy networks typically show RTTs between 5–20ms, but spikes to 80–200ms suggest latency issues caused by interference or overloaded links [16]. Use the RTT Graph (Statistics > TCP Stream Graph) to visualize these spikes [17]. Apply
tcp.analysis.ack_rtt > 0.1to highlight packets with RTTs over 100ms [17][19]. - Zero Window Events: These occur when a receiver’s buffer is full, forcing the sender to stop transmitting. Filter with
tcp.analysis.zero_windowto identify these events [2]. If a server repeatedly advertises Zero Windows, the bottleneck is likely at the application level. On the other hand, if the client shows Zero Windows, it might be overwhelmed by the server’s response rate. - Time Deltas: Delays between packets can indicate application-level slowness. Use
tcp.time_delta > 0.1to find gaps of more than 0.1 seconds between consecutive packets [19]. Comparing time deltas with RTT can help determine whether the issue lies in the network or the application.
It’s worth noting that checksum errors often result from Checksum Offload, where the NIC calculates checksums after packet capture. These errors can usually be ignored during performance analysis [19].
Detecting Anomalies in Encrypted Traffic
Encrypted traffic hides payloads, but metadata can still provide valuable clues:
- Server Name Indication (SNI): During the TLS Client Hello, the SNI field reveals the target hostname in plaintext. Use
tls.handshake.extensions_server_nameto extract these hostnames and cross-check them against known malicious domains or unauthorized services [20]. - TLS Handshake Issues: Monitor for handshake problems like "certificate_unknown" alerts or unsupported cipher suites. Filter
tls.handshake.type == 1to isolate Client Hello packets [20][22]. If the handshake doesn’t complete (no "Finished" message), the issue might be related to certificates or interception attempts [21]. Self-signed certificates from untrusted CAs are a major warning sign, especially in sensitive environments. - Decrypting Traffic: For deeper analysis, decrypt traffic using key log files. Set the
SSLKEYLOGFILEenvironment variable (e.g.,export SSLKEYLOGFILE=/path/to/sslkeys.logon Linux) and configure Wireshark to use this file under Preferences → Protocols → TLS [20][22]. This allows you to view full URLs and application-layer content. Keep in mind that modern TLS protocols require session-specific keys for decryption.
Always validate certificates by examining the "Certificate" message (ssl.handshake.type == 11). Check the issuer, expiration date, and public key [21]. Expired or untrusted certificates often point to man-in-the-middle attacks or misconfigurations, especially in secure environments where such anomalies are rarely harmless.
Advanced Wireshark Features for Cleared Professionals
Building on basic packet analysis, Wireshark offers advanced tools that can make a big difference for professionals working in secure environments. These features go beyond simple filtering, helping analysts handle the unique challenges of secure workflows. Tools like the Expert Information feature and the TShark command-line utility allow you to process and interpret data more efficiently, cutting through the noise of raw packet captures.
Using the Expert Information Tool
The Expert Information tool is like having a built-in assistant for packet analysis. It scans your capture file and categorizes anomalies by severity: Error (Red), Warning (Yellow), Note (Cyan), and Chat (Blue). This system highlights critical issues right away, saving you from hours of manually sifting through packets. Nawaz Dhandala emphasizes its importance:
Expert Information should be your first action after opening a capture – it immediately flags the most serious problems, saving you hours of manual packet-by-packet inspection [26].
To access it, go to Analyze → Expert Information. From there, sort by severity to tackle the most critical entries first. Clicking on an entry takes you directly to the corresponding packet in the main list, giving you immediate context. The color-coded circle in the bottom-left of the status bar provides a quick overview of your capture’s health – Green means all is normal, while Red indicates errors [26].
For reporting, you can right-click within the Expert Information dialog to export findings for detailed incident reports. If you’re troubleshooting specific problems, use display filters like tcp.analysis.flags to zero in on issues or expert to view all flagged packets.
| Severity Level | Color | Examples |
|---|---|---|
| Error | Red | Malformed packets, dissector issues |
| Warning | Yellow | Connection resets (RST), zero window, out-of-order packets |
| Note | Cyan | TCP retransmissions, duplicate ACKs |
| Chat | Blue | SYN/FIN packets, window updates |
Introduction to TShark for Command-Line Analysis
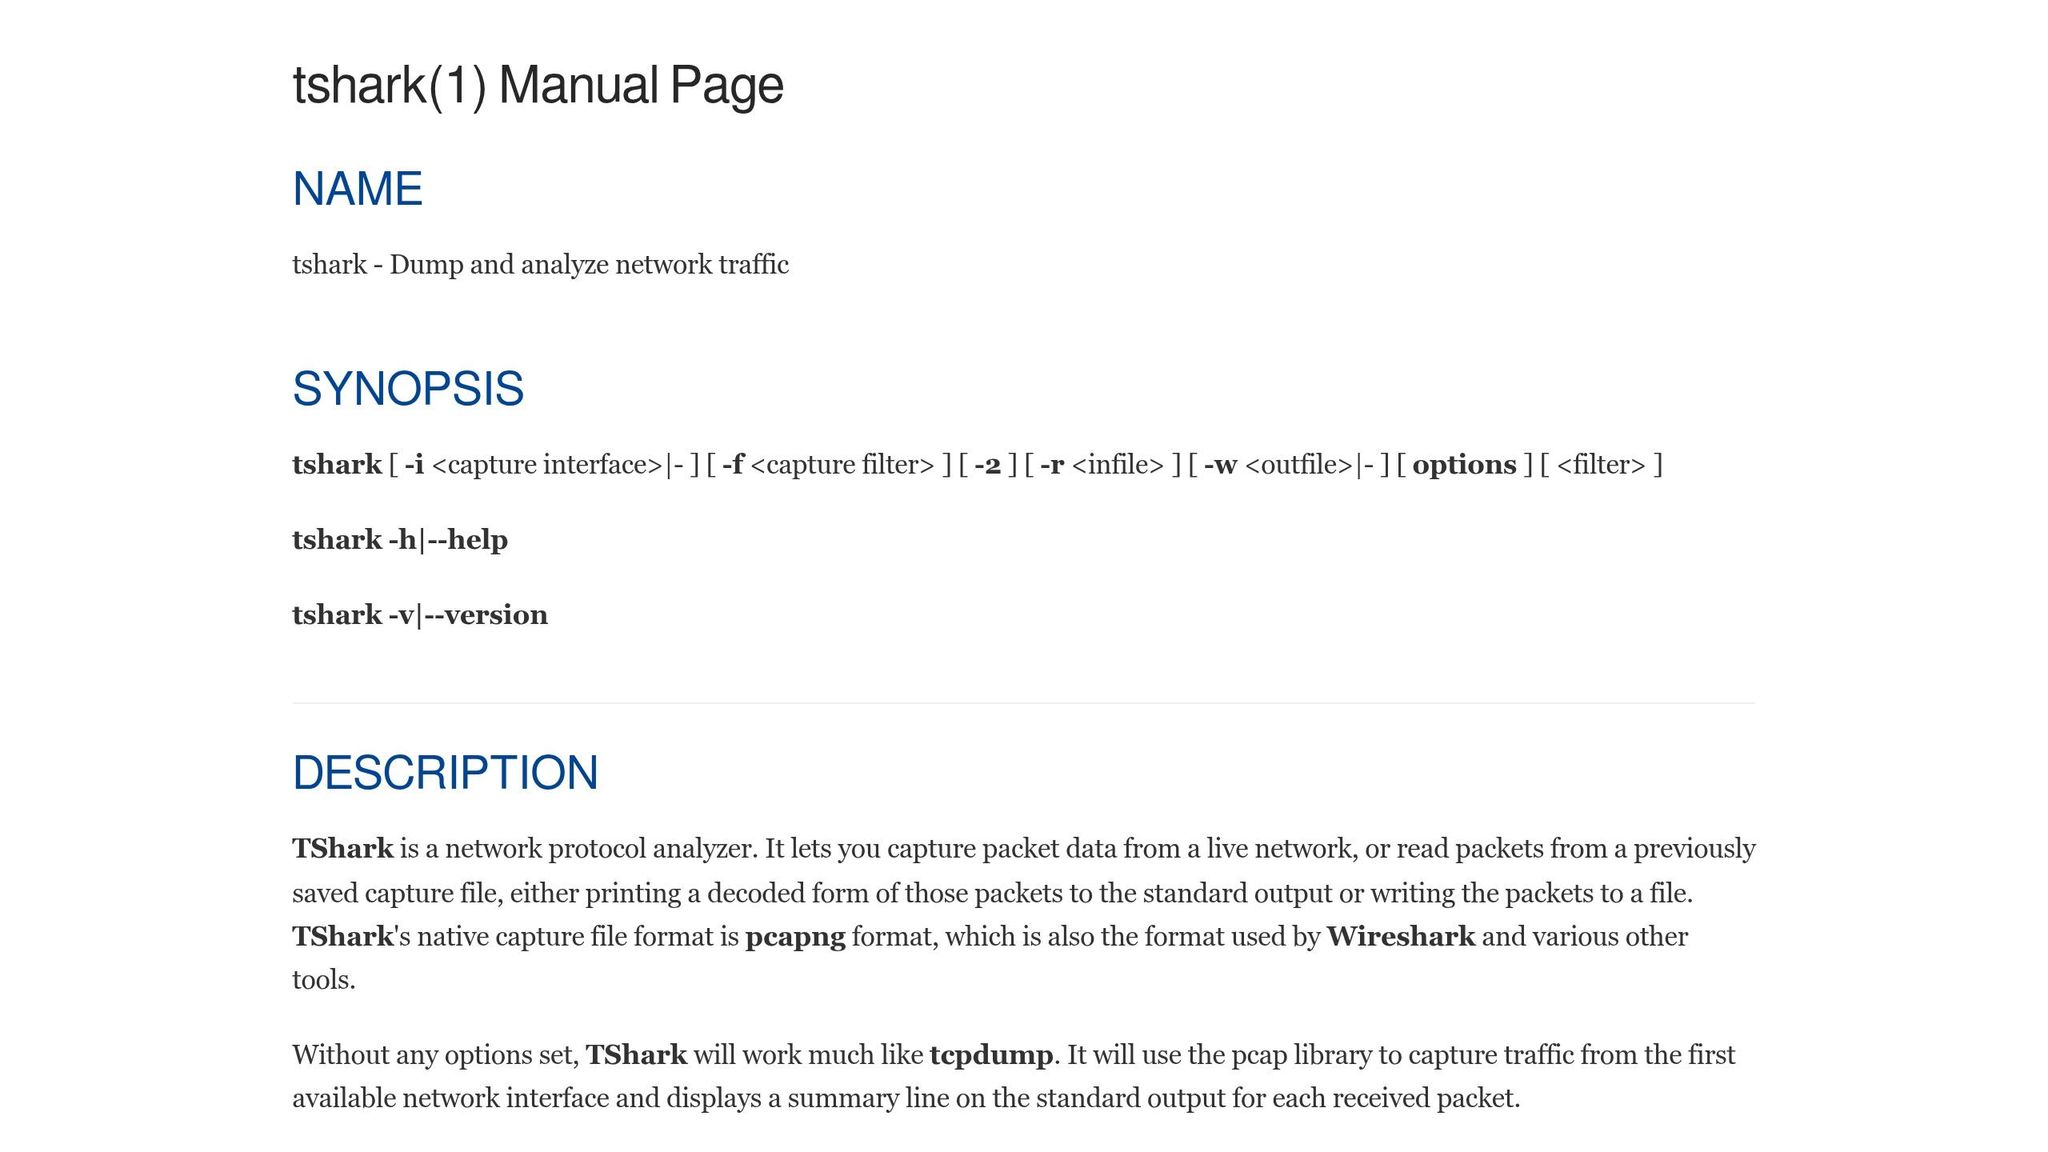
TShark, Wireshark’s command-line counterpart, is a powerful tool for automated analysis, especially on headless or remote systems. It’s perfect for integrating packet analysis into scripts and workflows in secure environments.
For a quick summary of network issues, run:
tshark -r capture.pcap -q -z expert
This command highlights all errors and warnings without opening the GUI [23]. To focus on warnings and more severe issues, use:
tshark -r capture.pcap -q -z expert,warn.
TShark also excels at extracting specific data fields for automation. By combining the -T fields option with the -e flag, you can pull metadata like ip.src or dns.qry.name, making it easy to integrate with other tools. For example:
tshark -r <file> -q -z endpoints,ip
This command identifies the most active IP addresses in a capture, helping you quickly spot potential command-and-control traffic [23].
If you’re working with encrypted traffic, TShark supports decryption using the -o tls.keylog_file:<path> preference. This allows you to decrypt TLS 1.3 sessions without needing the server’s private key [25][26]. Additionally, the -T json option outputs packet data in JSON format, making it easy to feed into SIEM systems or other automated analysis tools [24]. Just remember to avoid running TShark as root – add your user to the Wireshark group instead [23].
These advanced features make Wireshark and TShark indispensable tools for cleared professionals, streamlining complex analysis and improving efficiency.
Conclusion
Wireshark equips cleared network security analysts with the tools they need to gain deep visibility into network traffic, making it easier to detect lateral movement, data exfiltration, and command-and-control communications [2]. By using capture filters to manage file sizes during collection and display filters for targeted post-capture analysis, analysts can turn overwhelming packet data into actionable insights [2].
When you pair basic strategies with advanced tools, network analysis becomes even more powerful. The Expert Information tool speeds up the detection of protocol violations and TCP errors, while TShark brings packet analysis to command-line workflows, making it easier to integrate with scripts and SIEM systems [1][2]. Mastering protocol-specific analysis is what sets top-tier analysts apart. Whether it’s identifying DNS tunneling with dns.qry.name.len > 50, detecting command-and-control beaconing with IO Graphs set to 1-second intervals, or decrypting TLS traffic using pre-master secret log files, these methods provide solid evidence for defensive measures [2]. As Laura Chappell from Chappell University emphasizes:
You really do want to master display filters in Wireshark. That is the ideal way to find the needle in the haystack [3].
To streamline your workflow, consider creating custom filter buttons for common tasks, like identifying unusual User-Agent strings or tracking large outbound data transfers. This ensures your analysis is both precise and efficient – critical in environments where accuracy is non-negotiable [2].
FAQs
What’s the safest way to capture packets in a cleared environment?
To ensure secure packet capture, tools like Wireshark’s command-line utility, dumpcap, can be used effectively by following strict protocols to prevent data leaks. Here’s how to do it safely:
- Use dumpcap with limited privileges on an isolated system to minimize risks.
- Set a time limit for captures by using the duration option.
- Focus on secure and controlled network segments, steering clear of critical infrastructure unless explicitly authorized.
Always adhere to your organization’s policies and legal requirements to stay compliant.
When should I use a capture filter vs a display filter?
When using packet capture tools, a capture filter helps you control the data collected right from the start. Written in BPF (Berkeley Packet Filter) syntax, these filters allow you to exclude irrelevant traffic, ensuring only the necessary data is recorded during the capture process.
On the other hand, a display filter comes into play after the data has already been captured. These filters are highly flexible, enabling you to zero in on specific protocols, fields, or other criteria within the captured traffic for a more focused analysis.
How can I investigate suspicious TLS traffic without decrypting it?
To dig into suspicious TLS traffic, start by analyzing metadata and traffic patterns. Tools like Wireshark are great for this. You can filter and inspect encrypted packets, looking for oddities such as unusual packet sizes, irregular timing, or strange connection behaviors.
Pay close attention to the TLS handshake details. Key elements like the Server Name Indication (SNI) or protocol information can reveal unexpected server names or abnormal connection frequencies. The best part? You don’t need decryption keys to do this. By focusing on the visible data, you can uncover potential threats efficiently and without breaking encryption.