• Skip to primary navigation
  • Skip to main content
Cleared Cyber Security Jobs | CyberSecJobs.com

Cleared Cyber Security Jobs | CyberSecJobs.com

Cleared Cyber Security Jobs

  • Home
  • Search Cleared Cyber Jobs
  • Job Fairs
  • Career Resources

Uncategorized

Elastic SIEM for Cleared Security Analysts Skills Guide

CyberSecJobs Editorial · April 26, 2026 ·

Elastic SIEM is a powerful tool designed for security analysts in high-security environments like defense and intelligence. It centralizes log and event data, enabling faster threat detection and compliance with strict regulations. Key features include:

  • 1,700+ Prebuilt Detection Rules: Updated biweekly, aligned with MITRE ATT&CK.
  • Elastic Common Schema (ECS): Simplifies data normalization across sources.
  • AI and Machine Learning: Automates anomaly detection, alert triage, and response.
  • Compliance Support: Meets retention policies like OMB M-21-31 and NSM-8.
  • Host Isolation: Contains incidents quickly in sensitive environments.

Elastic SIEM supports on-premises and air-gapped setups, making it ideal for classified networks. Analysts can enhance their skills in query languages (KQL, ES|QL), rule creation, and case management. Mastering Elastic SIEM opens doors to advanced roles, with salaries ranging from $60,000 to $200,000 annually. Certifications like Elastic Certified SIEM Analyst further validate expertise.

This guide covers workflows, tools, and configurations tailored for cleared environments, helping analysts streamline operations and meet compliance standards efficiently.

Core Features of Elastic SIEM
Elastic SIEM

Data Ingestion and Normalization

Elastic SIEM simplifies data management by using the Elastic Common Schema (ECS) to standardize vendor-specific data into a unified format. Instead of dealing with multiple field names like src, client_ip, or src_ip for a source IP address, analysts can rely on a single field: source.ip. This eliminates the hassle of rewriting queries every time a new data source is integrated.

Eric Beahan from Elastic highlights the importance of this approach:

"By normalizing data to a single common model, you can uniformly examine your data using interactive search, visualizations, and automated analysis."[9]

This streamlined structure is especially helpful in environments where analysts need to correlate events across firewalls, endpoints, and cloud systems without wasting time on custom mappings. Once data is mapped to ECS, it instantly supports Elastic’s library of 1,300+ prebuilt detection rules and over 70 machine learning jobs, significantly reducing the need to build custom analytics from scratch[6].

Elastic Agent and Beats handle ECS field population during data ingestion, while ingest pipelines enrich the data with additional context like GeoIP, user agent details, and host metadata. For more specialized data sources, Elastic uses Large Language Models (LLMs) to create custom integrations that align with ECS. Security teams can also enforce validation rules to catch issues like missing ecs.version or incorrect event.category values, ensuring that all data is accurate and ready for effective threat detection.

This unified framework is the backbone for deploying advanced detection rules and leveraging AI-driven analytics.

Pre-Built Detection Rules and AI Capabilities

With ECS-normalized data in place, Elastic Security offers 1,300+ detection rules crafted by experts and aligned with the MITRE ATT&CK framework. These rules cover 54 different data sources and are updated biweekly – over 2,420 updates were made in 2024 alone – to keep pace with evolving threats[6][12]. This ensures analysts have up-to-date protection without the burden of manually maintaining rules.

Elastic supports various detection methods to identify threats effectively:

  • Event Correlation (EQL): Tracks multi-step attack sequences by analyzing event patterns.
  • Indicator Match: Compares logs against threat intelligence feeds to flag known risks.
  • Threshold-Based Detection: Identifies anomalies like brute-force attacks by monitoring event volumes.
  • New Terms Detection: Highlights previously unseen field values, useful for spotting unusual activity in stable environments[10].

The Elastic AI Assistant (available in the Enterprise tier) enhances productivity by resolving query errors, crafting detection rules, and automating alert triage and remediation tasks[6]. Kseniia Ignatovych from Elastic describes its purpose:

"Elastic Security is designed to help detection engineers – and anyone else responsible for security operations – build, manage, and optimize detection rules at scale so that you can focus on what matters most: protecting your organization."[6]

To combat alert fatigue, Elastic includes alert suppression, which consolidates similar alerts into a single notification. This allows analysts to concentrate on genuine threats rather than being overwhelmed by redundant alerts[6].

Entity Analytics and Anomaly Detection

Elastic SIEM incorporates over 70 prebuilt machine learning jobs, which analyze two weeks of historical data to establish baselines and then monitor for anomalies. These jobs detect unusual patterns such as rare processes, unexpected network activity, or suspicious logins, making them particularly effective in sensitive environments[6][8][11].

For instance:

  • The packetbeat_dns_tunneling job identifies an unusually high number of DNS queries to a single domain, which can indicate command-and-control (C2) activity or data exfiltration[8].
  • The windows_anomalous_user_name_ecs job flags irregular user behavior that might suggest compromised credentials or lateral movement[8].
  • Population-based analysis, like the "Anomalous Process For a Population" job, reduces false positives by focusing on processes that are rare across the entire environment rather than just on individual hosts[8].

These features help analysts detect threats efficiently while minimizing manual work. To ensure accuracy, analysts in regulated environments can tune prebuilt rules to account for authorized administrative activity. For example, tools like PsExec or WMI, commonly used in government settings, may trigger alerts. Cloning existing rules and adding filters – such as and not user.name: "authorized-admin" – can help reduce noise while maintaining detection precision[13].

Elastic also offers a manual rule run feature, enabling analysts to test new detection logic against up to 90 days of historical data. This allows teams to refine thresholds and assess potential noise levels before deploying changes live[6].

sbb-itb-bf7aa6b

Required Skills and Workflows for Cleared Analysts

Alert Triage and Prioritization

Cleared analysts face a daunting challenge: managing 8,000 alerts daily per cluster generated by 65 unique detection rules. Reviewing every alert manually is simply not feasible[14]. To tackle this, analysts rely on tools like Elasticsearch Query Language (ES|QL) and Kibana Query Language (KQL) to filter and transform data efficiently. These tools allow analysts to sort alerts by factors such as severity, MITRE ATT&CK techniques, or affected entities, making the process more manageable[15][17][18].

Higher-Order Rules (HOR) play a crucial role in streamlining triage. Instead of treating each alert as an isolated incident, HOR connects related signals across endpoint, network, and cloud data sources to reveal attack patterns. Samir Bousseaden from Elastic Security Labs puts it this way:

"Independent detections converging on the same entity compound confidence, where each additional signal multiplies the likelihood that the activity is real, not benign"[14].

This approach has proven effective, with production tests reducing alerts to around 30 per day, a volume SOC teams can handle comfortably[14].

Tools like the Elastic AI Assistant and Attack Discovery simplify triage further by consolidating hundreds of alerts into actionable attack chains. This allows analysts to focus on investigations rather than sifting through endless alerts. Nearly 20% of Elastic security customers already use the AI Assistant to boost efficiency[16][18][20]. Additionally, alert suppression and custom tags (e.g., Triage:Asset or Triage:PMFA) help automate workflows through SOAR platforms like Tines, which can close over 3,000 alerts daily without human involvement[2].

Triage Step Action Estimated Time
Initial Assessment Review severity, risk score, and MITRE mapping 2 minutes
Context Gathering Query related events using ES|QL (host, user, IP) 3 minutes
Threat Intel Enrichment Check indicators against threat intelligence feeds 2 minutes
Classification Decide: True Positive, False Positive, or Benign 2 minutes
Documentation Record rationale and evidence in Case Management 1 minute

Once triaged, alerts feed into streamlined investigation workflows, enabling analysts to act quickly and efficiently.

Investigation and Incident Enrichment

After prioritizing an alert, analysts must gather detailed context fast. Tools like Timeline visualize event sequences across datasets, while Analyze process tree and Run Osquery provide immediate host-level insights[15]. For instance, if a suspicious PowerShell command is flagged, Osquery can help uncover persistence mechanisms or map out parent-child relationships in the process tree to trace the origin.

ES|QL is particularly effective for correlating alerts with operational anomalies. Analysts can query system metrics – like CPU spikes or memory usage – to uncover compromises that may otherwise go undetected. Familiarity with ECS (Elastic Common Schema) ensures smooth cross-domain investigations by using consistent field mappings[14].

For threat intelligence enrichment, native connectors can automatically check file hashes against VirusTotal or query external databases for known malicious indicators[5]. The AI Assistant further speeds up investigations by summarizing alerts, offering classification rationale, and even generating or refining detection rule queries[6][5][20]. Santosh Krishnan, General Manager of Security at Elastic, highlights the value of these tools:

"Attack Discovery will power productivity and supplement practitioner knowledge to speed up threat detection, investigation, and response. It helps your people – and SOC – succeed"[20].

Case Management and Automation

With enriched incident data in hand, effective case management becomes crucial. Kibana Cases centralize all relevant information – attack summaries, alerts, observables, and events – into a single view[4]. Analysts can also add custom fields to track metrics like Mean Time to Resolution (MTTR) or trigger automated detection tuning requests with a click[19]. The Similar cases feature identifies recurring observables, offering insights into threat actor behavior[4].

Repetitive tasks can be automated using YAML-based Kibana playbooks. These playbooks handle tasks like checking VirusTotal, gathering host context, and sending alerts via Slack or PagerDuty[5]. A May 2024 workflow implemented by the Elastic InfoSec team is a striking example: by leveraging Tines and Elastic Security, they automated the triage and closure of over 50,000 alerts in 30 days. Custom tags like Triage:PMFA (used for phishing-resistant MFA checks) and Triage:Workstation (to verify managed status through proxy logs) played a key role. This automation eliminated the need for an estimated 94 additional full-time employees while maintaining visibility[2].

For critical actions like host isolation, workflows can be configured to pause for human approval via Slack, email, or Kibana UI[5]. When closing alerts – whether manually or through automation – specific reasons such as "False Positive", "Benign Positive", or "Duplicate" should be documented. This practice improves future filtering and enhances metrics[15].

Automation doesn’t replace analysts; it empowers them. As Crossley McEwen from Elastic puts it:

"Automation isn’t about replacing people; it’s about elevating them. When tedious tasks are handled by systems, analysts are freed to think, lead, and act"[16].

Configuring Elastic SIEM for Cleared Environments

Compliance and Governance

Elastic SIEM is designed to help cleared environments meet strict compliance standards while maintaining advanced detection capabilities. These environments often need to adhere to frameworks like CMMC, NIST 800-171, and NSM-8. Elastic SIEM supports all three CMMC levels – Foundational (Level 1), Advanced (Level 2), and Expert (Level 3) – making it a strong choice for defense contractors and government agencies[21]. Whether deployed on-premises, in the cloud, or within air-gapped networks, the platform is built to adapt to various operational needs[3].

A key compliance requirement is data retention. For example, NSM-8 mandates 72 hours for full packet capture, 12 months for active logs, and 18 months for cold storage. Elastic addresses this with its frozen tier storage and searchable snapshots, which can cut storage costs by up to 90% while maintaining fast search capabilities[22]. As Ken Melero, Public Sector Expert at Elastic, highlights:

"The speed and success of cyber incident response can be significantly influenced by the amount and nature of data recorded in network logs, as well as how that data is retained and accessed."[22]

Elastic’s Event Correlation System (ECS) ensures field standardization with mappings like @timestamp, event.kind, and event.category. This standardization simplifies cross-source correlation and auditing[7]. For effective governance, analysts should align custom detection rules with the MITRE ATT&CK framework to identify any gaps in coverage[24]. To manage noise from authorized activities – like security testing or admin scripts – it’s better to clone and modify prebuilt rules rather than disabling them. This approach reduces alert fatigue while preserving an audit trail[13][25].

Requirement Category Best Practice Configuration Compliance Alignment
Data Retention Use Frozen Tiers with Searchable Snapshots NSM-8, EO 14028[22]
Access Control Apply Role-Based Access Control (RBAC) CMMC Level 2, NIST 800-171[21]
Integrity Enable File Integrity Monitoring (FIM) CMMC Level 3, NIST 800-172[21]
Threat Detection Map custom rules to MITRE ATT&CK framework NSM-8, Section 7[22][24]

These compliance measures are further supported by Elastic SIEM’s operational capabilities, such as advanced host isolation and incident response features.

Host Isolation and Response Actions

In cleared environments, swift incident containment is essential. For high-severity alerts like "Windows Event Logs Cleared", Elastic SIEM offers native host isolation capabilities. These work seamlessly with Elastic Defend and third-party EDR platforms like CrowdStrike, Microsoft Defender for Endpoint, and SentinelOne[23]. For organizations using CrowdStrike’s government cloud, the connector must be configured with the US-GOV base URL: https://api.laggar.gcw.crowdstrike.com[26].

To adhere to security best practices, configure API clients with least privilege access. Create separate API clients for data access and action execution, ensuring each has only the permissions it requires[26]. Within Kibana, response actions need specific feature privileges under "Actions and Connectors" and "Endpoint Security", along with roles like SOC Manager or Endpoint Operations Analyst[26].

Automating response workflows can significantly reduce Mean Time to Respond (MTTR). Before deploying these workflows in classified networks, test them with open-source threat emulation tools like Stratus Red Team or Pacu to ensure they work as intended[26].

Elastic’s commitment to supporting on-premises users is evident in its platform overview:

"Unlike cloud-only providers, Elastic treats on-prem users as first-class citizens, with full SIEM capabilities even in air-gapped or DIL environments."[3]

For instance, in 2024, Sierra Nevada Corporation (SNC), a leading defense contractor, utilized Elastic Security to protect its infrastructure across both on-premises and cloud environments while meeting stringent security standards[3]. This example underscores Elastic’s ability to handle sensitive, defense-related operations while meeting compliance needs.

Introduction to Elastic Certified SIEM Analyst Exam preparation

Career Benefits of Elastic SIEM Expertise
Elastic SIEM Skill Progression for Cleared Security Analysts

Elastic SIEM Skill Progression for Cleared Security Analysts

Skill Development for Cleared Roles

For security analysts working in cleared environments, gaining expertise in Elastic SIEM can lead to both operational excellence and promising career growth. Analysts enhance their skills in areas like AI-augmented workflows for alert summarization, query conversion, and automation. They also become adept in advanced query languages such as ES|QL, KQL, and EQL, which are crucial for identifying and mitigating complex attacks within classified networks[6][27][28].

The Elastic Common Schema (ECS) serves as a standardized framework, enabling analysts to correlate diverse data types from networks, endpoints, and cloud environments. This unified structure is particularly beneficial in government settings, where data is often stored in silos[28][27]. Advanced users can leverage "Detections as Code" (DaC) to bring version control and automated testing into rule management[6]. Organizations using AI-enhanced SIEM tools have reported impressive results, including a 300% boost in alert fidelity and a 34% decrease in investigation time[1][30].

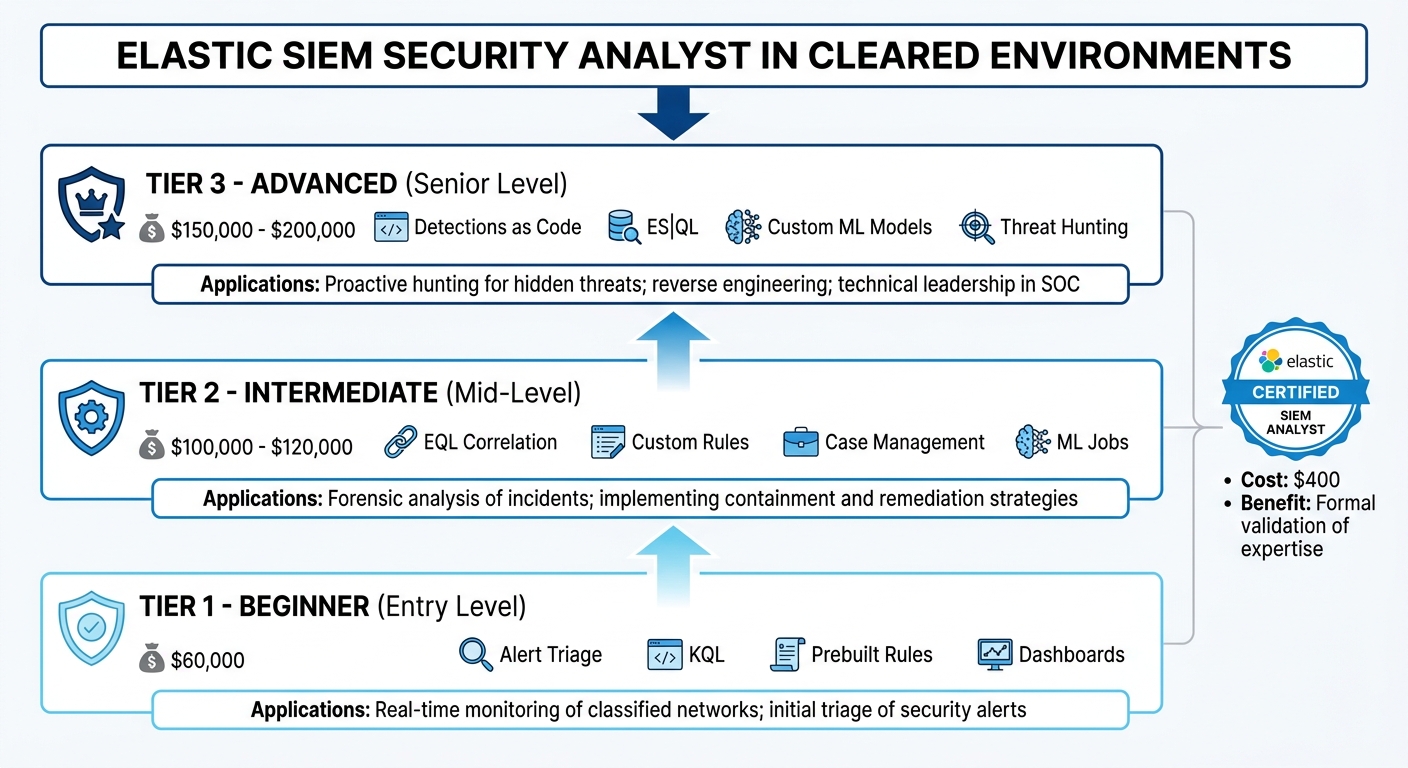
The table below outlines the progression of skills for professionals working with Elastic SIEM, from foundational to advanced roles.

Skill Progression Table

Skill Level Elastic SIEM Features Cleared-Specific Applications
Beginner (Tier 1) Alert Triage, KQL, Prebuilt Rules, Dashboards Real-time monitoring of classified networks; initial triage of security alerts.
Intermediate (Tier 2) EQL Correlation, Custom Rules, Case Management, ML Jobs Forensic analysis of incidents; implementing containment and remediation strategies.
Advanced (Tier 3) Detections as Code, ES|QL, Custom ML Models, Threat Hunting Proactive hunting for hidden threats; reverse engineering; technical leadership in SOC.

Mastering these skills enhances operational performance and creates pathways to advanced roles and leadership positions.

Long-Term Career Impact

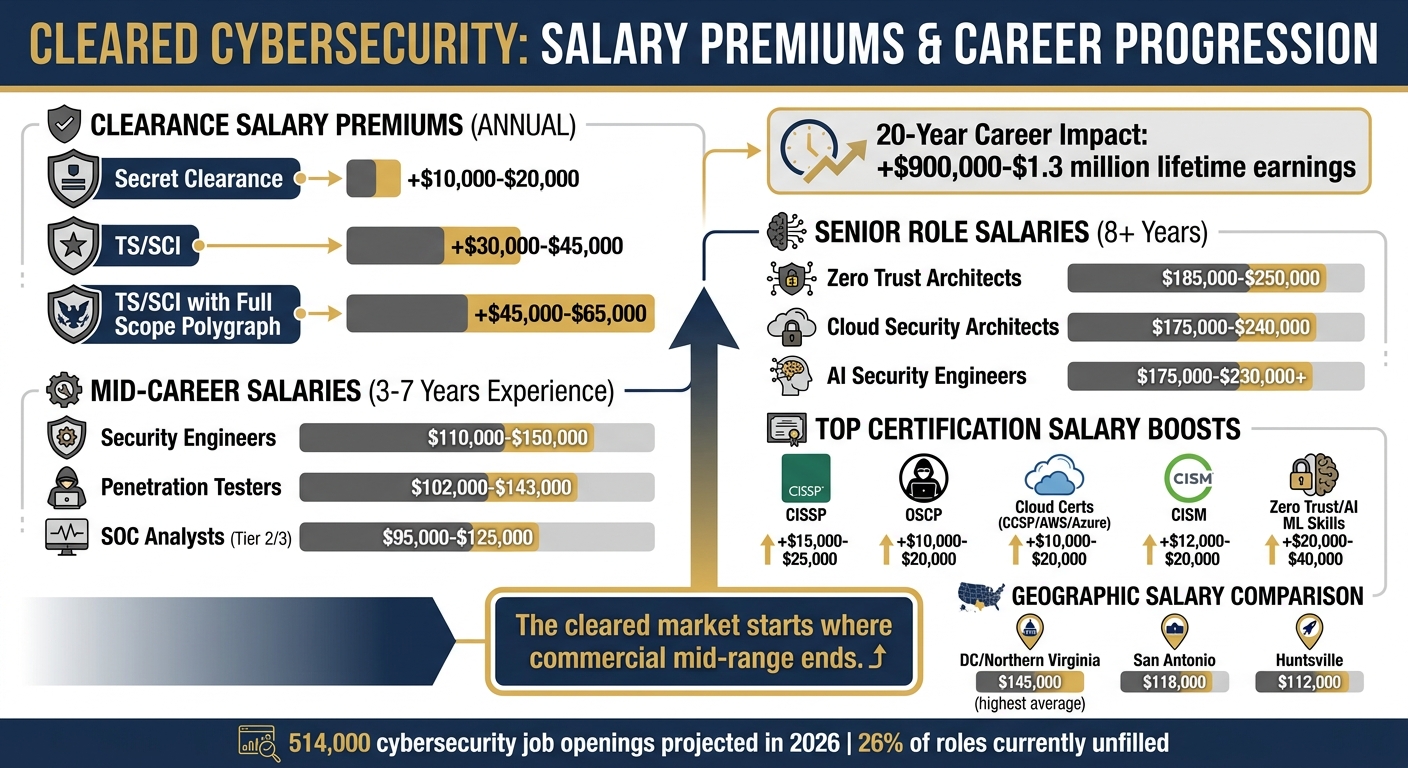
Elastic SIEM expertise can significantly boost earning potential. Entry-level analysts can expect salaries starting around $60,000, while senior professionals may earn up to $200,000 annually[29]. Additionally, the Elastic Certified SIEM Analyst certification, priced at $400, is a valuable credential that validates skills and opens doors to new opportunities[32].

Lucian P., Founder & Principal Consultant, highlights the value of certification:

"Taking the certification shows you the power of Elastic. [This certification] started getting recognized for this by our customers and they now know they are dealing with professionals."[31]

This expertise not only enhances roles within Security Operations Centers (SOC) but also paves the way for strategic positions such as Security Architect, Security Engineer, and SOC Manager[29].

Conclusion

This guide has shown how Elastic SIEM reshapes both security operations and career growth for professionals working in high-security, cleared environments. Gaining expertise in Elastic SIEM is a critical skill for security analysts, boosting both operational efficiency and career opportunities. Its secure architecture – designed with on-premises users as "first-class citizens" – makes it an excellent fit for environments where data residency and sovereignty are non-negotiable priorities [3].

Take Sierra Nevada Corporation, for example. In 2025, they achieved a tenfold increase in data ingestion while slashing query times from minutes to seconds using Elastic’s AI-driven SIEM. This improvement enabled them to offer a managed service that became a revenue generator. Similarly, Proficio achieved a 34% reduction in investigation time and a 75% improvement in response speeds, saving an estimated $1 million over three years [1]. With features like federated search across petabytes of data and access to over 1,300 prebuilt detection rules [6], Elastic SIEM demonstrates its ability to transform security operations. These results not only enhance organizational security but also pave the way for strong career advancement.

Elastic SIEM doesn’t just improve workflows – it also opens doors to significant career progression. Cleared professionals can move from entry-level roles, which typically pay around $60,000 annually, to senior positions earning over $200,000 per year as they master tools like ES|QL, KQL, and Detections as Code [29]. The Elastic Certified SIEM Analyst credential, priced at $400, provides formal recognition of these skills. As Jesse P., a Search Development Specialist, explains:

"When you get certified, you are going to be really valuable. People from all over the world are coming to me asking about Elasticsearch" [31].

Additionally, the integration of AI-driven analytics and natural language tools reduces the burden of manual tasks, allowing analysts to focus on advanced threat hunting. Features like Attack Discovery streamline alert triage, turning hundreds of alerts into actionable attack chains. This shift transforms analysts’ roles from reactive alert management to proactive security engineering, elevating both individual careers and organizational resilience in cleared environments [1][20]. By mastering Elastic SIEM, professionals not only safeguard their organizations but also position themselves for leadership roles in the rapidly evolving cybersecurity landscape.

FAQs

What data sources should I ingest first to get the most value from Elastic SIEM?

To make the most out of Elastic SIEM, focus on bringing in network traffic logs, endpoint data, and application logs first. These key data sources are essential for gaining visibility into potential threats and responding to incidents effectively. Starting with these logs creates a solid base for your security efforts and makes it easier to incorporate more data sources down the road. This approach ensures efficient monitoring and thorough investigation right from the beginning.

How do I tune prebuilt detection rules to reduce false positives from authorized admin activity?

To minimize false positives caused by legitimate admin activity in Elastic SIEM, start by cloning and customizing detection rules to align with your environment’s typical behavior and exceptions. Include exceptions for known admin tasks to avoid triggering unnecessary alerts. You can also tweak risk scores and turn off rules that seldom generate useful alerts. Head over to the Rules page in Elastic Security to efficiently manage, edit, and prioritize your detection rules.

What’s the best way to use ES|QL, KQL, and EQL together during alert triage and investigations?

Effectively working with ES|QL, KQL, and EQL means tapping into their specific strengths during various stages of alert triage and investigation. Use KQL to quickly filter and search within the SIEM interface, EQL to dive into event sequences and identify correlations over time, and ES|QL for crafting detection rules that demand complex data transformations or aggregations. Using these tools together streamlines workflows and improves precision in detecting threats.
Related Blog Posts

  • Cleared Blue Team Jobs Complete Career Guide
  • Splunk for Cleared SOC Analysts Complete Skills Guide
  • QRadar for Cleared SOC Analysts Complete Skills Guide
  • ArcSight for Cleared SOC Analysts Complete Skills Guide

ArcSight for Cleared SOC Analysts Complete Skills Guide

CyberSecJobs Editorial · April 26, 2026 ·

ArcSight is a critical tool for cleared SOC analysts managing classified environments. It centralizes log collection, event correlation, and threat detection, ensuring security events are identified and addressed in real time. This guide covers key skills like configuring log collection, creating correlation rules, and using ArcSight’s components effectively.

Key Takeaways:

  • Core Components: SmartConnectors (log collection and normalization), ArcSight ESM (real-time event correlation), and Logger (secure log storage).
  • Log Management: Use SmartConnectors for encrypted log collection and FlexConnectors for custom log parsing. Optimize by filtering unnecessary logs.
  • Event Correlation: Build rules to detect patterns like log-clearing (Windows Event ID 1102) or privilege escalation. Use Active Lists to track trends over time.
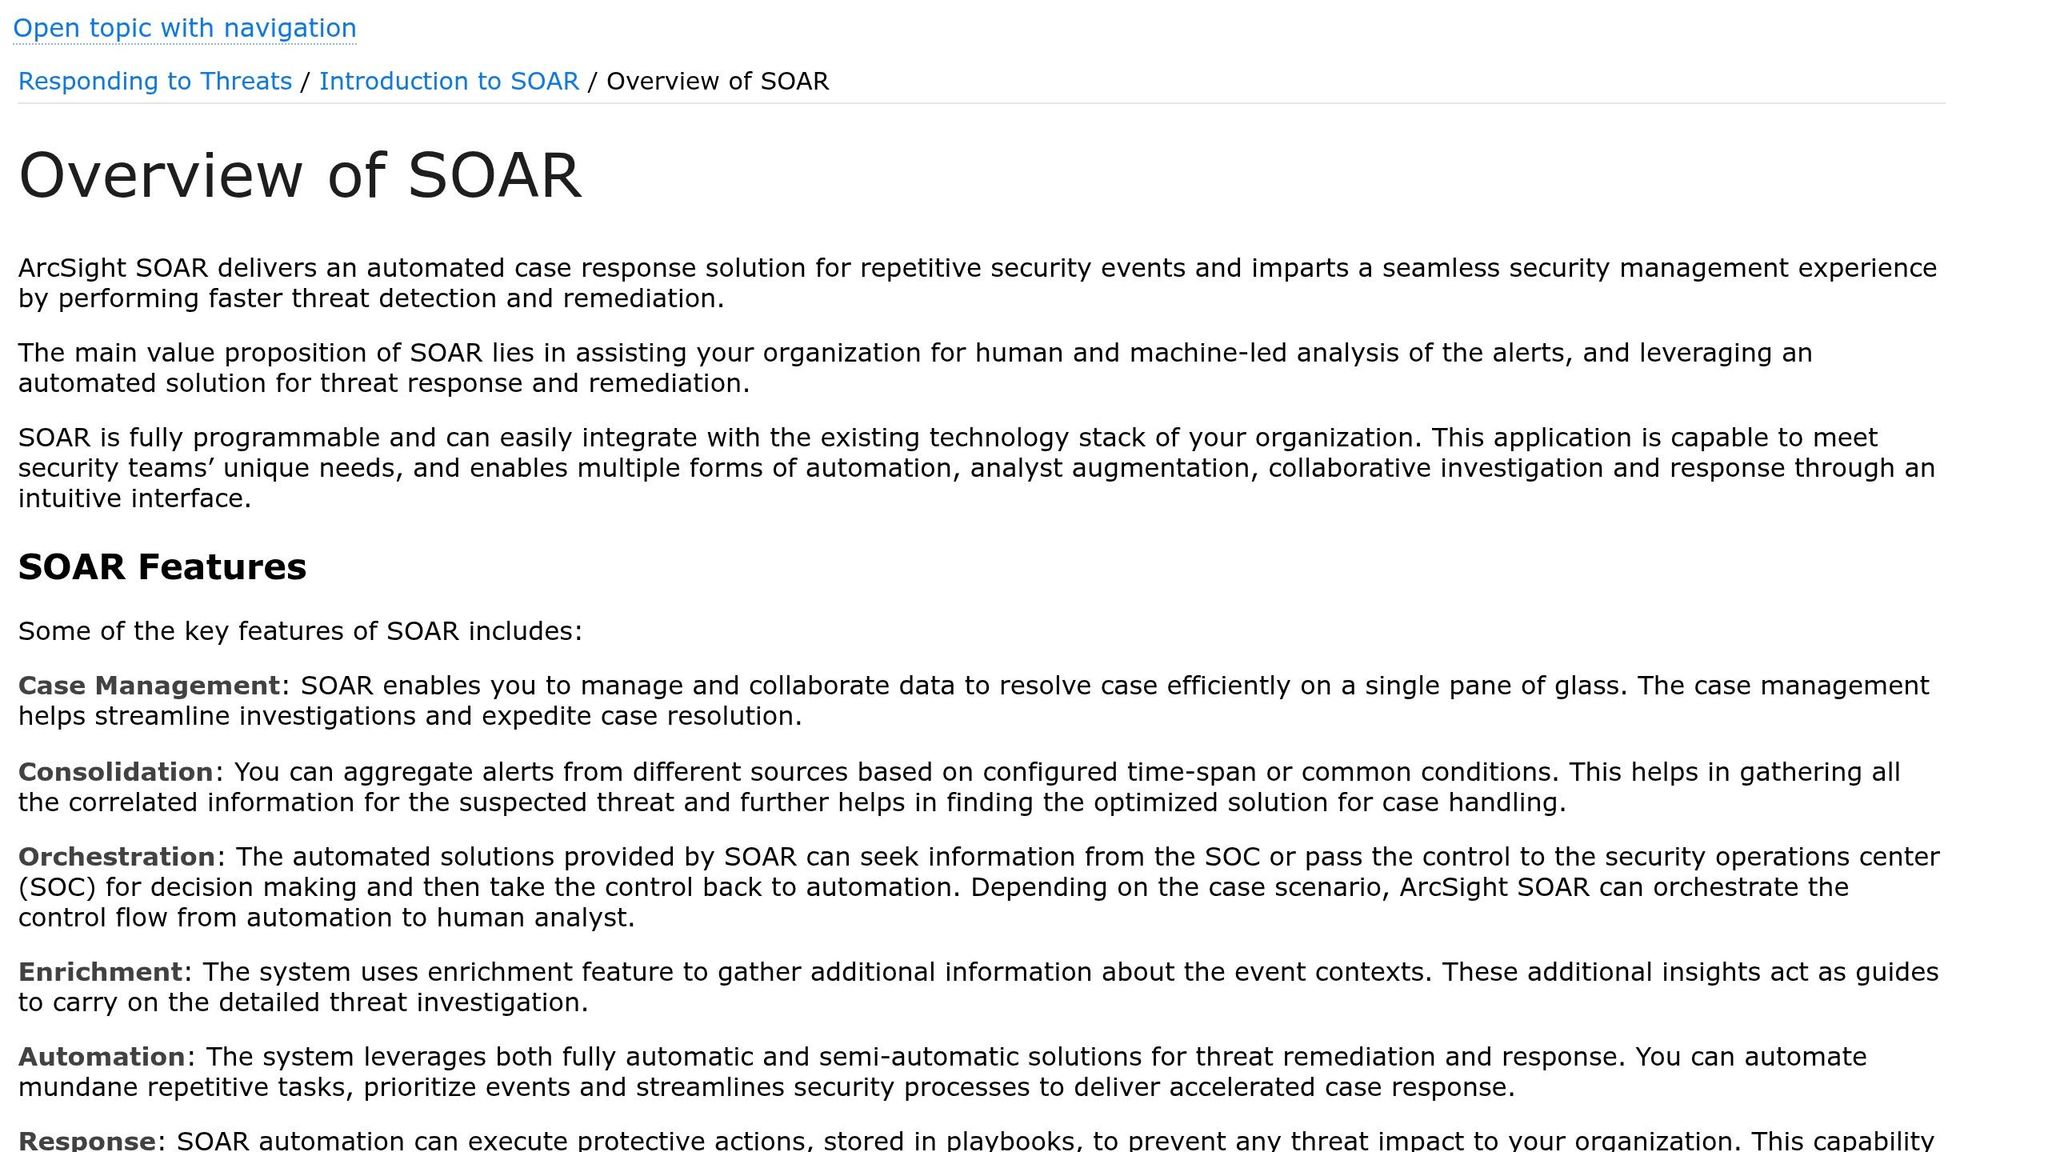
  • Incident Response: Leverage ArcSight SOAR for automated triage, case management, and swift remediation.
  • Compliance: Ensure tamper-proof log storage with WORM solutions and follow regulatory standards like PCI-DSS and HIPAA.
  • Integration: Connect ArcSight with tools like Active Directory for enriched event data and threat intelligence feeds for enhanced detection.

ArcSight’s capabilities help SOC analysts detect threats, maintain compliance, and safeguard sensitive systems. This guide equips you with practical tips to maximize its potential.

ArcSight SIEM Architecture Explained with Real-World Use Case

ArcSight

sbb-itb-bf7aa6b

ArcSight Components and Architecture

ArcSight Architecture: 4 Core Components for SOC Security Monitoring

ArcSight Architecture: 4 Core Components for SOC Security Monitoring

Main Components of ArcSight

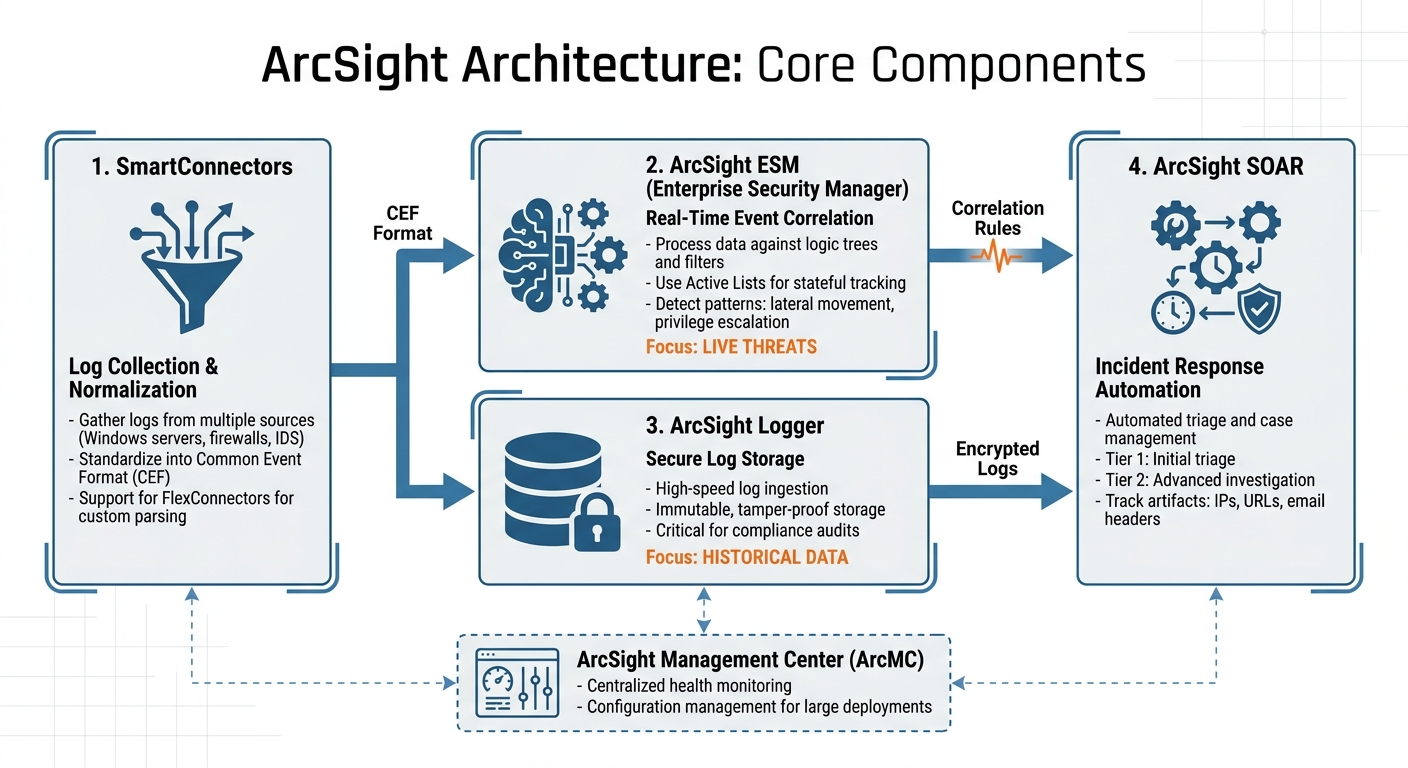
ArcSight operates through four key components, each playing a vital role in security monitoring. First, SmartConnectors gather logs from a variety of sources – Windows servers, firewalls, intrusion detection systems, and more. These logs, often in different formats, are standardized into Common Event Format (CEF) to enable consistent analysis across your entire system.

The ArcSight ESM (Enterprise Security Manager) handles real-time event correlation. It processes incoming data against logic trees, filters, and Active Lists – dynamic collections that monitor attributes over time, like tracking users who access sensitive systems. This stateful tracking is essential for spotting suspicious activities, such as lateral movement or privilege escalation, especially in sensitive environments. Meanwhile, ArcSight Logger ensures high-speed log ingestion and secure, immutable storage. This feature is critical for maintaining the integrity of evidence, particularly for legal and compliance audits in sectors like government and defense.

For larger deployments, ArcSight Management Center (ArcMC) simplifies the management of SmartConnectors by centralizing health monitoring and configuration updates through a single interface. Additionally, modern setups often include built-in SOAR (Security Orchestration, Automation, and Response) tools. These tools streamline incident response by automating triage and workflows, helping your team respond to threats faster. Together, these components create a cohesive system tailored for the complex demands of a cleared SOC.

ArcSight’s Role in SOC Operations

With these components working in unison, ArcSight serves as the backbone of cleared SOCs. The ESM continuously monitors event streams, applying correlation rules to detect suspicious patterns and trigger immediate alerts. This real-time detection is invaluable for intercepting attackers before they can erase critical forensic evidence.

Logger complements ESM by adhering to strict retention policies required in classified environments. Its immutable storage capabilities allow for incident analysis even months after the fact, ensuring forensic evidence remains intact and reliable. The division of responsibilities is clear: ESM focuses on live threats, while Logger ensures historical data is preserved for compliance reviews and in-depth investigations.

This separation of duties is especially important in air-gapped environments, where external support may not be an option. In such cases, understanding whether an issue stems from ingestion, storage, or correlation logic can be the key to resolving visibility gaps effectively.

Log Management and Event Correlation Skills

Log Collection and Management

Accurate log collection is a must-have skill for cleared SOC analysts. Start by deploying SmartConnectors as services on either Windows or Linux systems, ensuring they’re set to auto-start after any system reboot. In cleared environments, configure these connectors to use "ArcSight Manager (encrypted)" as the destination. This setup is crucial for maintaining your Authority to Operate (ATO) and meeting federal auditing standards.

When installing, make sure to select the "Import Certificate from your ArcSight ESM" option. This ensures a trusted and encrypted connection. For larger Windows environments, consider using Windows Event Forwarding (WEF). WEF allows you to collect logs from multiple machines at a central point before sending them to ArcSight, which minimizes the number of individual connectors you need to manage.

FlexConnectors play a key role in normalizing logs into the Common Event Format (CEF). This is achieved using Parser and Categorizer files, which map incoming data to ArcSight’s schema. Fields like source IP, username, and Event ID are standardized during this process. For Windows systems, Parser files should be placed in OS-specific directories under $ARCSIGHT_HOME, and the SmartConnector service must be restarted to apply changes. This level of precision is essential in cleared environments to meet strict auditing standards.

To optimize storage and reduce unnecessary noise, configure connectors to collect only the logs you actually need. For instance, if you’re monitoring a specific application suite, select only the "Application" log type during setup instead of gathering all event types. You can verify proper event receipt and parsing by monitoring Active Channels in the ArcSight Console. Once logs are collected and normalized, the next step is to turn them into actionable intelligence using ArcSight’s correlation rules.

Event Correlation with ArcSight ESM

ArcSight ESM

Once the logs are properly collected, correlation rules transform raw data into actionable insights. These rules are designed to identify patterns of related events. For example, a successful login from an unusual IP address followed by Event ID 1102 (audit log cleared) could signal malicious activity. ArcSight’s stateful tracking through Active Lists is especially useful here, as it allows you to monitor attributes over time and detect trends like lateral movement or privilege escalation.

In cleared SOCs, it’s important to strike a balance between sensitivity and operational practicality. Use whitelists for authorized administrators and account for scheduled maintenance windows in your correlation rules to minimize false positives and reduce alert fatigue. ArcSight’s identity and asset correlation features help distinguish routine administrative actions from suspicious behavior. For example, while clearing logs during scheduled maintenance might be normal for a domain admin, the same action by a standard user account raises immediate red flags.

"The integrity of security logs is crucial because these logs are the primary evidence used to detect and investigate security breaches." – ExamCollection [5]

Create rules to detect "logging silence" – a sudden drop in log volume that could indicate an attacker has disabled logging services or cleared logs. For Windows environments, focus on Event IDs like 1102 (log cleared), 4624 (successful login), and 4625 (failed login). On Linux systems, monitor for rsyslog/auditd restarts, sudo command usage, and changes to shell history. Regulatory frameworks such as PCI-DSS, HIPAA, and GDPR require detailed security logs for accountability, so your correlation logic must not only catch threats but also support compliance requirements effectively.

Threat Detection and Incident Response

Threat Detection with Rules and Dashboards

Creating effective detection rules tailored to your organization’s specific needs is key. ArcSight allows you to configure detection logic through its graphical interfaces for Rule and Test Conditions. To make tracking seamless across multiple data sources, it’s essential to map entity types like user accounts and computer names. For example, you can set a rule to trigger after detecting five failed login attempts from the same IP address within a 10-minute window. Be sure to associate each rule with the appropriate data source – such as CEF-formatted firewall logs – and review them regularly. This ensures outdated rules (inactive for 6–12 months) are adjusted or removed, and low-value alerts are minimized [6].

When a high-fidelity rule is triggered, having a swift and structured incident response plan in place is critical.

Incident Response with ArcSight SOAR

ArcSight SOAR

Refined detection rules feed directly into ArcSight’s SOAR platform, enabling quick case management and remediation. The platform organizes its interface into tiers: Tier 1 focuses on initial triage by providing essential context, while Tier 2 offers deeper insights for advanced investigations [9]. New cases are automatically enriched with threat intelligence, speeding up the remediation process [7][9]. Analysts can track key artifacts – such as IP addresses, URLs, and email headers – giving them a holistic view of the attack. From the case interface, response actions like blocking IPs or sending notifications can be executed. For high-risk actions in sensitive environments, approval gates can be set up to require supervisor sign-off. Additionally, for automated actions like blocking a host, setting a rollback interval is a good practice to allow for quick reversals if disruptions occur [9].

SOC teams face an overwhelming volume of alerts daily – about 4,500 on average – with 50%–99% being false positives and up to 67% ignored entirely [8]. However, organizations utilizing AI-driven automation have seen their mean time to respond (MTTR) drop from 5.7 days to just 1.8 days – a 68% improvement [8]. For environments with strict compliance needs, configuring SOAR settings like the DataRetentionMaxAge parameter can help automate case cleanup while maintaining audit trails [9].

Configuring ArcSight for Cleared Environments

Security Compliance and Auditing

In cleared environments, ensuring that logs are tamper-proof and traceable is non-negotiable. To achieve this, utilize WORM (Write Once, Read Many) or immutable storage solutions. These systems prevent any modifications to logs after they’ve been ingested – even by privileged users [3]. Your log retention policies should strictly adhere to the specific regulatory frameworks you operate under, whether it’s PCI-DSS, HIPAA, or federal compliance standards [3].

Set up correlation rules to catch critical events. For Windows systems, monitor Event IDs like 1102 (audit log cleared), 4719 (audit policies disabled), and 4739 or 4902 (audit policy changes) [5][3]. On Linux, keep an eye on unexpected restarts of services like rsyslog or auditd, as these could signal attempts to hide activity [3]. Use dashboards to track log volume trends and identify timestamp gaps, as these "silent periods" might indicate tampering [3].

Access control is another critical layer. Restrict log management permissions to authorized personnel only, and implement independent monitoring of administrative actions to create a secondary audit trail [3]. Additionally, integrate ArcSight with ticketing systems or SNMP traps to ensure alerts about potential log tampering are escalated to your response teams immediately [3].

Once these compliance and auditing measures are in place, you can configure ArcSight to support cleared roles effectively.

ArcSight Setup for Cleared Roles

Properly placing and configuring parser and categorizer files is essential for ArcSight’s functionality. For Windows environments, ensure the parser file matches the specific OS version. For example, logs from Windows Server 2016 require the windows_2016 parser, located in $ARCSIGHT_HOMEuseragentfcpwindowsfgwindows_2016. Similarly, for Server 2012, use the windows_2012 parser [4]. If you’re working with identity management tools like Centrify, place the centrify_suite.csv categorizer in the acpcategorizercurrent directory [4].

After updating any parser or categorizer files, restart the SmartConnector service to apply the changes. On Windows, this can be done through Windows Services, while Linux users can restart via /etc/init.d [4]. These steps ensure your configuration aligns with the compliance and security protocols discussed earlier.

Next, configure your firewall to allow access through critical ArcSight ports: 22 for SSH, 8443 for the web console, 9000 for the Manager, and 7789 for data transfer [10]. Define trusted administrative groups and subnets within ArcSight, and enable identity correlation to prioritize alerts when log-clearing actions are performed by unknown or unauthorized accounts [3].

Finally, validate your setup regularly. One way to test this is by manually clearing a test audit log and verifying that Event ID 1102 is captured and displayed correctly in the ArcSight console [5].

Integration, Enrichment, and Automation

Connecting ArcSight with Other Security Tools

ArcSight works well with other security tools, making it easier to streamline operations. For example, SOAR platforms like Google SecOps can directly link with ArcSight to automate case management workflows. With this setup, ArcSight can automatically update case stages – such as INITIAL, QUEUED, CLOSED, FINAL, or FOLLOW_UP – based on specific rules, cutting down on manual tasks for analysts. This integration uses HTTPS and SSL-secured APIs for inbound communication to ArcSight ESM, while outbound reports are delivered to shared folders via SMB (Ports 139/445) or NFS (Ports 111/2049).

For bringing in threat intelligence, REST FlexConnectors (version 7.10) can pull enriched Indicators of Compromise (IOCs) from external sources like Rapid7. This includes data like domains, URLs, IP addresses, and MD5 file hashes. To optimize performance, you can configure the system to fetch only "deltas" – new IOCs added since the last update. External tools can also programmatically populate ArcSight Active Lists, enabling analysts to use these lists for real-time correlation without manual input. When setting up API access, it’s good practice to create a dedicated user group (e.g., Google_SecOps_API) with "Normal User" permissions and tailored ACLs. This ensures external tools only access the event filters they need, enhancing security and control.

Adding Context to Event Data

ArcSight’s integration features don’t just improve workflows – they also enrich raw log data for more accurate analysis. Correlating assets and identities is especially important in secure SOC environments. For instance, a log-clearing event (Windows Event ID 1102) might be treated differently if the source user is a regular employee versus an authorized administrator [3]. By integrating ArcSight with tools like Active Directory or Okta, you can automatically link IP addresses to specific users and their roles [4].

"Arcsight’s architecture is designed to provide robust log management capabilities. It collects logs continuously from a variety of sources… Once collected, logs are parsed and normalized into a common schema, which allows for consistent querying and analysis regardless of the original source." – ExamCollection [3]

To enhance process visibility, you can enable "Include command line in process creation events" (Windows Event ID 4688) through Group Policy Objects. This lets analysts see the exact commands executed during a security event [13]. Additionally, by using a .jsonparser.properties file, you can map external enrichment data – like "Last Seen" or "Source Name" – to ArcSight’s deviceCustomString fields, ensuring the data is fully searchable in the ESM console. ArcSight connectors can also assign severity levels using a 1–10 scale: 1–2 for very low, 3–4 for low, 5–6 for medium, 7–8 for high, and 9–10 for critical [11].

Workflow Automation with ArcSight

Automation plays a key role in speeding up response times and allowing analysts to focus on complex investigations. ArcSight supports automation for Active Lists, enabling tasks like automatic addition, cleanup, and retrieval of entries – essential for real-time threat containment and indicator management [14]. Background daemons also help collect Query Viewer results and manage ESM cases without manual intervention.

ArcSight can be configured to auto-generate CSV reports for extracting event IDs through connectors and for deeper API-driven analysis. In highly secure environments, "Bridge" execution is recommended for automation engines instead of cloud-based execution, ensuring tighter data flow control and compliance [14]. Automated jobs can also be set up to clean Active List entries regularly, preventing outdated data from slowing down ESM performance [14]. Integration with threat intelligence platforms allows up to 10 specific data tokens per event, mapping fields like iocType, iocValue, and enrichment into ArcSight’s custom string fields [12].

Practical Tips and Use Cases

Building on the configuration and integration techniques already mentioned, these practical tips can help you get the most out of ArcSight in cleared environments.

Tips for Using ArcSight Effectively

Filter at the source to cut down on unnecessary noise. By configuring SmartConnectors to drop events you know are harmless before they even reach the ESM, you ensure your system focuses on actual threats. Keep an eye on connector health regularly – this helps you spot any gaps in log collection or bottlenecks early.

Fine-tune correlation rules to reduce false positives. For instance, set frequency thresholds (like more than one event within a five-minute window) and whitelist trusted administrators. Linking event data with asset metadata and identity information is also key – this helps you prioritize alerts based on the importance of the system involved. For example, a log-clearing event on a domain controller should raise immediate flags, while the same action on a standard workstation might just be routine maintenance.

If you’re working in large environments, use Windows Event Forwarding (WEF) to simplify log collection. To capture potentially malicious activity, enable "PowerShell Script Block Logging" and "Module Logging" through Group Policy Objects (GPO). This ensures you catch obfuscated commands that attackers might use before wiping logs [13].

Develop dashboards that monitor log volume trends. These can help you quickly spot anomalies, like a sudden drop in events from a specific host, which could indicate tampering or an active compromise. In cleared environments, storing logs on write-once-read-many (WORM) media or immutable storage ensures that logs can’t be altered after they’re ingested, keeping you compliant with regulatory requirements.

These tips provide a strong foundation for applying ArcSight effectively in real-world scenarios.

ArcSight Use Cases in Cleared SOCs

When applied in cleared SOCs, these optimizations lead to actionable results.

Detecting log clearing is critical in cleared environments. Attackers often try to hide their tracks by clearing Windows Event ID 1102 (Audit Log Cleared) or restarting services like rsyslog or auditd on Linux systems. ArcSight can correlate these activities with suspicious login behavior, helping identify coordinated malicious actions across multiple hosts. By setting up correlation rules for critical events – like log-clearing and policy changes – you can quickly detect tampering [1][2][5].

Scalable monitoring becomes vital when managing thousands of endpoints. Using WEF with ArcSight provides comprehensive visibility into process creation (Event ID 4688) and PowerShell activities across your infrastructure. This method eliminates the need for configuring individual agents on each endpoint, reducing administrative workload while maintaining thorough coverage [13].

Compliance and auditing are often key drivers for ArcSight deployments. The platform offers a centralized audit trail that meets regulatory standards like FIPS 199, PCI-DSS, and HIPAA by ensuring logs remain unaltered after ingestion. Plus, integrating threat intelligence feeds allows ArcSight to automatically flag events tied to known malicious actors. This ensures that alerts are prioritized, especially when log-clearing is detected on potentially compromised systems [1][2].

These use cases show how ArcSight can be a powerful tool for maintaining security and compliance in even the most demanding environments.

Conclusion

Becoming proficient with ArcSight offers cleared SOC analysts a strong advantage. Its ability to centralize logs, correlate events, and maintain tamper-proof audit trails makes it indispensable for meeting the rigorous compliance standards in federal and defense sectors. Gaining expertise in configuring SmartConnectors, crafting scenario-based rules, and identifying threats shifts your role from reactive monitoring to proactive defense.

"By mastering the ArcSight SIEM tool, you will be significantly geared towards ensuring a secure, reliable, and threat-free digital environment." – John Price, SubRosa

This guide highlights essential strategies to refine your skills. From log normalization to integrating threat intelligence, these practices align with the stringent requirements of cleared environments. Advanced techniques, such as User Entity Behavior Analytics (UEBA) and behavior-based anomaly detection, can position you for senior roles in areas like threat hunting and security architecture.

Incorporate these methods into your daily workflow. Add asset and identity context to enrich event data, and create feedback loops to adapt your monitoring to emerging threats. These steps not only reduce alert fatigue but also enhance detection accuracy and ensure swift responses to critical incidents. By consistently applying these techniques, you protect operations while meeting the high demands of cleared environments.

ArcSight serves as a powerful tool for career growth in the cleared SOC field. The more effectively you use its capabilities, the more indispensable you become to your organization and the broader security community.

FAQs

How do I know if a missing alert is an ingestion, parsing, or correlation issue?

When an alert is missing in ArcSight, you can narrow down the issue by following these steps:

  • Ingestion: First, verify that raw logs are reaching the SmartConnector. If the logs are missing at this stage, the problem lies with ingestion.
  • Parsing: If logs are successfully ingested but not parsed correctly, it can prevent alerts from triggering. Check the parsing process to ensure the data is being interpreted as expected.
  • Correlation: If parsing is working but alerts are still not appearing, take a closer look at the correlation rules. Misconfigurations or logic errors in these rules could be the culprit.

Each step focuses on a critical part of the process, helping you pinpoint where the issue might be.

What’s the safest way to tune ArcSight rules without increasing false negatives?

To fine-tune ArcSight rules without compromising detection accuracy or increasing false negatives, focus on adjusting rule thresholds and aggregation settings. The goal is to strike a balance between sensitivity (catching real threats) and specificity (avoiding unnecessary alerts).

When making adjustments, avoid aggregating over session list fields that are multi-mapped or overlapping, as this can lead to redundant or irrelevant alerts. Instead, refine these settings carefully to prevent unnecessary noise.

Take an iterative approach: monitor how the rules perform after each adjustment, and tweak thresholds gradually. This method helps you reduce false positives while ensuring no real threats slip through the cracks. Small, incremental changes are key to achieving effective tuning without overwhelming your system or missing critical alerts.

Which log sources should I onboard first in a classified SOC?

To build a strong monitoring and incident response framework in a classified SOC, start by integrating critical log sources like Windows Event Logs and logs from key network devices. These logs are essential for gaining visibility into system activities and detecting potential threats effectively. Prioritizing these sources lays the groundwork for reliable threat detection and response capabilities.

Related Blog Posts

  • SOC Analyst Career Path for Cleared Professionals Tier 1 to Lead
  • Cleared Blue Team Jobs Complete Career Guide
  • Splunk for Cleared SOC Analysts Complete Skills Guide
  • QRadar for Cleared SOC Analysts Complete Skills Guide

QRadar for Cleared SOC Analysts Complete Skills Guide

CyberSecJobs Editorial · April 25, 2026 ·

Master QRadar to excel in high-security SOC roles. This guide is designed for security-cleared analysts working in government or defense sectors, offering actionable skills for threat detection, incident response, and compliance with standards like CMMC and NIST 800-171. QRadar combines SIEM, SOAR, EDR, and NDR, enabling full incident lifecycle management. Key updates, such as quantum-proof capabilities in version UP15 (April 2026), enhance its relevance for secure environments.

Key Highlights:

  • QRadar Expertise: Learn advanced threat hunting with Ariel Query Language (AQL), configure Custom Rules Engine, and leverage User Behavior Analytics (UBA).
  • Technical Skills: Understand OSI/TCP models, key ports, firewalls, and Linux/Windows event analysis.
  • Certifications: IBM Certified SOC Analyst – QRadar SIEM V7.5 Plus and CompTIA CySA+ are crucial for career growth.
  • Hands-On Practice: Use QRadar Community Edition for lab training and real-world scenario exercises.
  • SOC Operations: Manage offenses, perform root cause analysis, and align workflows with MITRE ATT&CK.

Next Steps: Focus on certifications, hands-on labs, and expanding skills in compliance frameworks and query languages like AQL, KQL, and SPL.

Learn IBM QRadar in 7 Hours 🔥 | SOC & Threat Hunting Course

sbb-itb-bf7aa6b

Technical Prerequisites for QRadar

To effectively work with QRadar, it’s essential to have a solid grasp of networking and operating system fundamentals.

Networking and Operating System Basics

A strong understanding of the OSI Model (7 layers) and the TCP/IP Stack (4 layers) is crucial for analyzing network traffic and identifying malicious activity [7]. This includes differentiating between TCP (reliable, using a three-way handshake) and UDP (faster but connectionless) [7]. Familiarity with key port numbers – such as 22 for SSH, 53 for DNS, 80 for HTTP, 443 for HTTPS, and 3389 for RDP – enables quicker detection of anomalies in flow records [7].

"Understanding [OSI] layers is crucial for analyzing network traffic and identifying malicious activity." – Aayushi Pawar, Cybersecurity Researcher [7]

Proficiency in IP addressing is also vital. You’ll need to work with IPv4 and IPv6, CIDR notation, subnetting, and private address spaces defined by RFC1918 to pinpoint source and destination assets in QRadar [7]. In fact, 17.54% of permanent SOC Analyst job postings explicitly require TCP/IP knowledge, and 26.32% highlight the need for foundational firewall skills [[6]](https://www.itjobswatch.co.uk/jobs/uk/soc analyst.do). You should also understand the differences between stateful and stateless firewalls, Access Control Lists (ACLs), and IDS/IPS systems to interpret security data ingested by QRadar [7].

Since QRadar operates on Linux, mastering Linux service management (e.g., using systemctl) and tools like Bash is critical. Additionally, skills in Windows event log analysis and PowerShell enhance your troubleshooting capabilities [5][[6]](https://www.itjobswatch.co.uk/jobs/uk/soc analyst.do). Familiarity with QRadar’s core services, such as ecs-ec (event parsing and mapping) and ecs-ep (rule processing), is also beneficial for resolving data ingestion issues [5].

With these foundational skills, you’ll be better equipped to spot attack patterns and make the most of QRadar’s capabilities.

Threat Vectors and Attack Patterns

The ability to recognize common attack patterns in logs and flows is what sets effective analysts apart. For example, you should be able to identify beaconing activity, where malware regularly communicates with command-and-control (C&C) servers [8]. Similarly, spotting unusual port and protocol usage, like MySQL traffic on port 13306 instead of the standard 3306, can indicate a compromise [8].

Phishing remains one of the most common threats, often involving malicious links in emails that exploit vulnerabilities such as improper bounds checking in browser tags [10]. With QRadar’s integration with IBM X-Force Threat Intelligence, you can cross-check IP addresses and domains against known malicious activity [8]. For detecting insider threats, QRadar’s UBA (User Behavior Analytics) can help identify authentication anomalies, policy violations, and suspicious access to sensitive data [8][9].

Understanding network flow anomalies is especially valuable in environments where logging might be disabled by attackers. For instance, QRadar’s QFlow data can still provide insights into source and destination details, as well as data transfer sizes [10]. Using QFlow’s Deep Packet Inspection (DPI), you can detect sensitive data exposure, such as credit card numbers or Social Security numbers, within traffic payloads [8]. While QRadar comes with over 750 pre-configured rules to detect abnormal behaviors and attacks, fine-tuning these rules requires a clear understanding of underlying threat patterns [8].

"Logs + Flows + Threat Intel + Vulnerabilities + Asset Discovery = QRadar’s real power." – Ankit Bandu Jungade, Security Professional [8]

It’s important to note that enterprise SIEMs detect only 21% of techniques outlined in the MITRE ATT&CK framework, and 13% of correlation rules fail to trigger [1]. This underscores the importance of understanding protocols and attack patterns – automation alone isn’t enough.

QRadar Architecture and Core Components

QRadar Architecture: Three-Layer Data Processing System

QRadar Architecture: Three-Layer Data Processing System

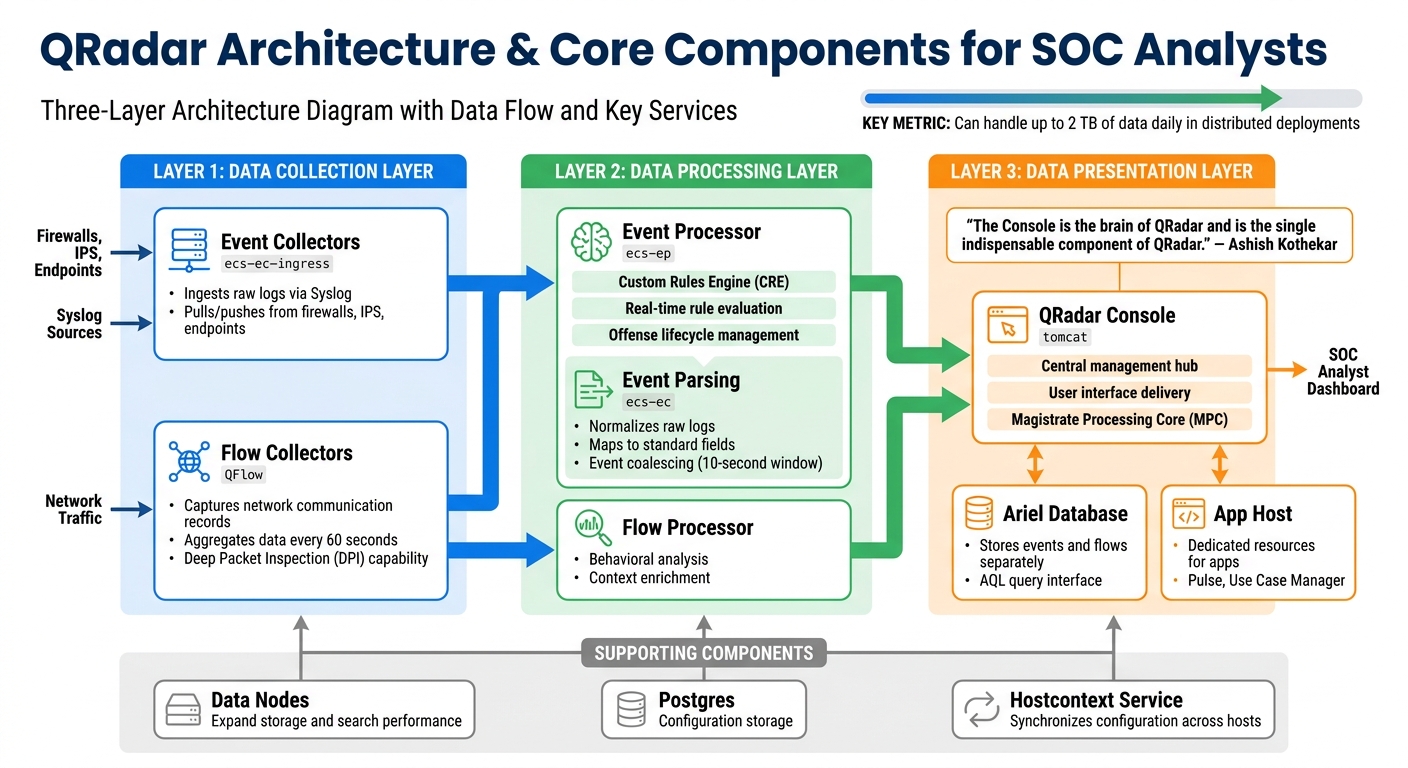
QRadar operates on a three-layer architecture: data collection, processing, and presentation. Here’s how it works: the Data Collection Layer gathers raw logs and network flows, the Data Processing Layer applies correlation rules to identify potential threats, and the Data Search Layer provides a user interface for analysts to investigate and respond [3]. This modular setup allows for horizontal scaling without compromising performance.

Main Components of QRadar

At the heart of QRadar is the QRadar Console, which serves as the central management hub. It uses the Tomcat service to deliver the user interface, manages offenses via the Magistrate Processing Core (MPC), and oversees reporting and administrative tasks [5][11].

"The Console is the brain of QRadar and is the single indispensable component of QRadar. It can collect and process data and throw alerts based on the rules." – Ashish Kothekar [5]

Event and Flow Collectors are the entry points for data. They ingest raw logs from sources like firewalls, IPS devices, and endpoints through protocols such as Syslog. The ecs-ec service then parses these logs into readable formats and normalizes them, mapping data to standard fields like IP addresses and usernames [11]. A handy feature called event coalescing consolidates identical events occurring within a 10-second window into a single record, saving both storage and processing power [11].

Event and Flow Processors use the Custom Rules Engine (CRE) to evaluate incoming normalized data against security rules in real time. When a rule condition is met, the ecs-ep service generates offenses and manages their lifecycle, including creation, renaming, and linking related events [5][11]. Flow data, which provides behavioral insights, is aggregated and forwarded to processors every 60 seconds, offering context that individual event logs may overlook [3].

Data Nodes expand storage and enhance search performance by redistributing data across the deployment [11]. The Ariel Database stores event and flow data separately from configuration details (which are kept in Postgres). Analysts can use Ariel Query Language (AQL) to perform forensic searches [5]. The App Host ensures that applications like Pulse and Use Case Manager have dedicated resources, preventing them from overloading the Console during investigations [3].

Component Primary Service Role in SOC Operations
Console tomcat Provides the UI, manages user sessions, and centralizes management [5]
Event Collector ecs-ec-ingress Ingests raw logs from sources via pull or push mechanisms [5][3]
Event Processor ecs-ep Matches events against rules (CRE) and manages offense lifecycles [5]
Flow Collector QFlow Captures network communication records for behavioral context [5][3]
Data Node N/A Adds storage and processing capacity for scaling [3]
App Host N/A Dedicated environment for running apps without taxing the Console [3]

These components work together seamlessly to enhance SOC operations.

How QRadar Supports SOC Operations

QRadar simplifies log analysis by parsing and normalizing raw data through the ecs-ec service. This ensures that analysts see standardized fields like "Authentication Failure" regardless of the device generating the logs [5]. The Event Processor evaluates incoming data in real time, triggering offenses as soon as threats are detected [3]. By grouping related events, QRadar reduces alert noise and helps analysts focus on what matters.

Events provide immediate alerts, while flows offer a broader behavioral perspective [3]. For instance, an event might flag a single failed login attempt, but flow data could reveal that the same IP has been probing multiple internal systems over hours. In larger deployments, QRadar can handle up to 2 TB of data daily using distributed Event Processors configured for high availability [12].

The hostcontext service ensures configuration changes made on the Console are synchronized across all managed hosts, maintaining consistency in distributed architectures [5]. Analysts can monitor this service using systemctl status tomcat to troubleshoot UI availability issues on the Console [5]. Beyond automated offenses, QRadar allows analysts to craft detailed AQL queries to hunt for specific patterns, such as identifying IPs transferring over 1 MB of data or users logging into VPNs from multiple locations [3].

This architecture is indispensable for meeting the high demands of modern cybersecurity operations.

Log Analysis and Incident Response Workflows

Log Analysis and Event Correlation

QRadar takes a smarter approach to detecting attack patterns by correlating events and flows, rather than relying on isolated logs. Here’s how it works: events capture specific actions, like authentication failures, while flows provide a broader view of network traffic, showing the volume and direction of data movement. For instance, spotting eight failed login attempts (Event ID 4625) from one IP address within five minutes could signal a brute force attack. Similarly, over 500 DNS queries with average lengths exceeding 50 characters might point to DNS tunneling.

To dig deeper into threats, analysts can use Ariel Query Language (AQL). This helps uncover advanced risks, like fileless malware hidden in PowerShell commands – look for terms such as frombase64string, iex, or -enc in Sysmon Event ID 4104. Suspicious administrative activity can also be flagged by monitoring Domain Admin logins (Event ID 4624) during unusual hours, such as midnight to 5:00 AM, using Windows and Active Directory logs. It’s critical to ensure that Device Support Modules (DSMs) are parsing logs correctly because unparsed or "unknown" events might leave gaps in visibility.

"The strongest use-case is only as good as the logs it receives." – Yuksel, Cybersecurity Engineer [14]

Establishing baselines for normal network behavior – like typical data transfer volumes or standard login times – helps identify anomalies. In environments with strict security requirements, built-in tools are essential for root cause analysis, especially when data exports (like PCAPs) are restricted.

These insights feed directly into QRadar’s offense management system, enabling faster and more effective responses to security incidents.

Offense Management and Root Cause Analysis

Once robust log analysis is in place, QRadar’s offense management system ensures that threats are addressed quickly and efficiently. The process includes four key steps: Detection, Triage, Investigation, and Resolution. QRadar prioritizes offenses using a Magnitude score (ranging from 0 to 10), which is calculated based on Severity, Credibility, and Relevance. During triage, analysts use the Offense Summary Pane to review these metrics before diving deeper into the issue.

Root cause analysis is all about piecing together the full picture. QRadar makes this easier by allowing analysts to switch between Log Activity and Network Activity views to build a timeline of events. The platform’s right-click pivot feature simplifies investigations – analysts can quickly perform DNS lookups or related event searches by clicking on an IP address or username. Drilling down into the Raw Payload of an event often reveals critical details, such as an SQL injection string or a malicious PowerShell command, that generic correlation rules might miss.

Another key step is reviewing the Asset Profile, which provides details on known vulnerabilities using tools like Nessus or IBM X-Force. To reduce alert fatigue, analysts can use the False Positive wizard, which helps fine-tune rules. QRadar EDR’s Cyber Assistant, for example, can cut false positives by up to 90% [13]. It’s also important to track offenses from the same source over a 24-hour period, as this can reveal multi-stage attacks or lateral movement.

The Unified Analyst Experience (UAX) further simplifies the process by integrating SIEM, SOAR, and EDR data into a single case view. This consolidation speeds up analysis and helps analysts respond to threats more effectively.

Certifications and Career Development

Certifications play a key role in advancing your career, especially in cleared SOC environments, by building on essential QRadar skills.

IBM QRadar Certifications

IBM provides three certification levels tailored to different stages of your QRadar career. The IBM Certified Associate – Security QRadar SIEM V7.5 is the starting point, focusing on fundamental SIEM concepts and basic QRadar navigation skills[15]. For those already working as analysts, the IBM Certified Analyst – Security QRadar SIEM V7.5 (exam code C9005200) is a critical credential. It demonstrates your ability to use the QRadar GUI effectively, identify offense causes, and analyze security data[2].

The top-tier certification is the IBM Certified SOC Analyst – QRadar SIEM V7.5 with CompTIA Cybersecurity Analyst (F1000200). This dual certification combines QRadar-specific expertise with the broader cybersecurity analysis skills of CompTIA CySA+. It validates your capabilities in threat management, incident response, and data analysis, making it particularly valuable for roles requiring security clearance. For cleared analysts, this certification highlights a well-rounded technical profile that meets the demands of high-security environments[2][16].

These certifications cover key QRadar tools such as Use Case Manager, QRadar Assistant, Log Source Manager, and Pulse – essential for managing detection rules in cleared environments[2]. They also serve as a foundation for advanced training and practical experience.

Training Programs and Prerequisite Certifications

To prepare for these certifications, the IBM Digital Learning Platform (learn.ibm.com) offers self-paced courses and access to lab environments for practical learning. If you’re aiming for the combined certification and already hold a CompTIA CySA+ credential (CS0-002 or CS0-003), you must submit evidence of this third-party credential through the "Submit 3rd Party Credential" link in the "My Learning" menu to earn credit toward the certification[2].

CompTIA also provides exam discounts for candidates on the IBM certification path, offering an affordable way to strengthen your qualifications. Once certified, hands-on labs are a great next step to apply your skills in a cleared SOC environment.

Hands-On Practice and Skill Development

Getting hands-on experience with QRadar is crucial for cleared SOC analysts. Setting up a personal lab environment is a great way to develop practical skills without jeopardizing production systems.

Free Labs and Virtual Environments

IBM offers the QRadar Community Edition (CE), a free version designed specifically for learning and practice. As IBM describes:

"Community Edition is a fully-featured free version of QRadar that is low memory, low EPS, and includes a perpetual license" [17].

The CE version can handle up to 50 events per second and 5,000 network flows per minute. This makes it ideal for most training setups. You can install QRadar CE as an OVA file (around 4.1 GB) using virtualization platforms like VMware Workstation Pro or Oracle VM VirtualBox. To ensure smooth operation, your host system should have 8–10 GB of RAM, 250 GB of disk space, and 2–6 CPU cores. Configure the virtual network adapter to NAT or Bridged mode to enable internet access and communication with other virtual machines.

Once the OVA file is imported, log in as root and execute ./setup to start the installation. It’s essential to verify the SHA256 hash of the downloaded file against IBM’s official checksum to ensure the file’s integrity. After the setup, access the web interface at https://[VM_IP_Address] and immediately set the correct system time and timezone under "System and License Management" in the Admin menu – accurate timestamps are critical for effective correlation and forensic analysis.

To simulate real-world scenarios, forward syslog data from Linux virtual machines (like CentOS or Ubuntu) to your QRadar CE instance. This helps you practice integrating various log sources and refining event correlation. You can also expand your lab’s functionality by downloading additional apps or Device Support Modules (DSMs) from the IBM X-Force App Exchange.

For more advanced training, structured exercises like the QRadar101 Blue Team Challenge on platforms such as CyberDefenders are excellent. These challenges use real-world datasets, including Sysmon, Zeek, and Suricata logs, to replicate compromised financial network scenarios. Focus on tasks like detecting registry modifications (Event ID 13), tracking lateral movement techniques (e.g., wmiexec.py), and analyzing HTTP payloads for data exfiltration attempts. These exercises are perfect for sharpening your log analysis and incident response skills, which are vital for advancing your QRadar expertise.

Practicing QRadar in Cleared Environments

Once you’re comfortable with QRadar CE in a lab, you can adapt these methods to security-cleared networks. Use isolated subnets, such as 192.168.20.0/24, for activities like malware analysis and SIEM correlation exercises. Keeping these tasks separate from sensitive or classified systems is essential.

Develop your skills in AQL (Advanced Query Language) for in-depth log analysis on large datasets. Pay close attention to high-value Windows Event IDs, such as:

  • 3: Network connections
  • 8: CreateRemoteThread or injection activity
  • 13: Registry modifications
  • 4720: Account creation

Practice filtering "Payload Information" for keywords like "project", "md5", or "cmd" to identify potential threats [1].

Tailor your exercises to align with compliance frameworks like NIST 800-171, CMMC, and SOC 2. Build workflows that map QRadar rules and offenses to the MITRE ATT&CK framework. For example, use technique T1547.001 (Registry Run Keys/Startup Folder) to understand persistence mechanisms. In lab environments, manually adjust License Pool Management settings (setting EPS > 0 and FPM to 0) to avoid licensing issues. Strengthen your skills in attack timeline reconstruction by correlating logs from tools like Suricata, Sysmon, and PowerShell into a coherent narrative.

These practices will not only deepen your understanding of QRadar but also prepare you for the specific demands of cleared SOC operations.

Conclusion

Key Takeaways for SOC Analysts

If you’re aiming to excel in cleared environments, mastering QRadar is a must. Stay updated on its evolving capabilities and timelines to remain competitive [1]. Your security clearance is your most important asset, with over 40% of SOC Analyst job postings highlighting it as a requirement [[6]](https://www.itjobswatch.co.uk/jobs/uk/soc analyst.do). While QRadar expertise appears in 17.54% of job listings, the most sought-after skills include Security Operations (59.65%), Incident Response (49.12%), and general SIEM knowledge (54.39%) [[6]](https://www.itjobswatch.co.uk/jobs/uk/soc analyst.do).

It’s not just about knowing QRadar’s strengths; understanding its limitations is equally critical. Regularly auditing your correlation rules – such as reviewing which ones have triggered in the past 90 days and eliminating unnecessary ones – ensures your setup stays effective. While AQL is a valuable skill, pairing it with other query languages will prepare you for a broader range of challenges [1].

Prioritize skills that transfer across platforms. For instance, PowerShell and Python are mentioned in nearly 28% of SOC job postings [[6]](https://www.itjobswatch.co.uk/jobs/uk/soc analyst.do). Additionally, a solid grasp of compliance frameworks like NIST 800-171, CMMC, and CJIS is crucial for cleared environments. More importantly, focus on mapping detections to frameworks like MITRE ATT&CK and reconstructing attack timelines – these abilities often outweigh platform-specific expertise.

To future-proof your career, expand your skillset beyond QRadar and build a versatile toolkit.

Next Steps for Career Growth

Once you’ve mastered QRadar’s fundamentals, it’s time to broaden your cybersecurity skillset. If you’re already familiar with AQL, consider learning query languages like XQL (for Cortex XSIAM), KQL (for Microsoft Sentinel), or SPL (for Splunk) to prepare for potential SIEM transitions [1].

Remember, QRadar expertise is just one piece of the puzzle. Strengthening your skills in threat intelligence and automation can open doors to advanced roles. Specializing in areas like threat intelligence integration, behavioral analytics, and automated investigation workflows can help you transition into positions such as Threat Intelligence Analyst, Security Consultant, or SIEM Administrator [4].

Take advantage of your QRadar Community Edition lab to practice compliance reporting for defense and government contracts. Ongoing learning is non-negotiable – as the Blumira Security Team points out:

"The problem is not which SIEM you run. The problem is that custom rules require constant maintenance, and most teams do not have the staff to keep them current" [1].

To thrive in the long term, focus on continuously improving your detection capabilities and staying adaptable in the ever-changing cybersecurity landscape.

FAQs

What logs should I onboard first in QRadar for a cleared SOC?

When setting up logs in QRadar for a cleared SOC, it’s important to focus on Windows logs, including Sysmon logs and network flows. These logs play a crucial role in identifying threats and managing incidents effectively.

  • Windows Event Logs: These logs provide insights into system activities, user behavior, and security-related events.
  • Sysmon Logs: By enabling Sysmon, you gain detailed visibility into processes, network connections, and file activities.
  • Network Flows: Monitoring traffic patterns helps identify unusual activity and potential security threats.

How do I troubleshoot QRadar events that show as "Unknown" or unparsed?

To address QRadar events showing up as "Unknown" or unparsed, start by reviewing the parsing and mapping configurations in the DSM editor. Confirm that events are being properly parsed and mapped within the Log Activity section. If the problem continues, it might point to issues with the parsing rules or DSM configuration. Double-check these settings to ensure events are categorized as expected.

How can I map QRadar offenses to NIST 800-171/CMMC and MITRE ATT&CK?

  • MITRE ATT&CK: Leverage QRadar’s REST API to pull ATT&CK data. This allows you to connect offenses with specific adversary tactics and techniques, giving better insight into potential threats.
  • NIST 800-171/CMMC: Examine offense categories and indicators to align them with the controls outlined in these frameworks. Focus on how offenses tie back to security requirements, especially those related to safeguarding controlled unclassified information (CUI).

Related Blog Posts

  • SOC Analyst Career Path for Cleared Professionals Tier 1 to Lead
  • Cleared SOC Analyst Jobs Complete Career Guide
  • Cleared Blue Team Jobs Complete Career Guide
  • Splunk for Cleared SOC Analysts Complete Skills Guide

Splunk for Cleared SOC Analysts Complete Skills Guide

CyberSecJobs Editorial · April 25, 2026 ·

Splunk is a critical tool for SOC analysts working in cleared environments. It centralizes machine data, accelerates investigations, and supports threat hunting. This guide focuses on key skills, tools, and strategies to maximize Splunk‘s potential for security operations.

Key Takeaways:

  • Splunk Basics: Learn about its architecture (Forwarders, Indexers, Search Heads) and data stages (Hot, Warm, Cold, Frozen).
  • Search Processing Language (SPL): Master SPL queries for faster threat detection and analysis.
  • Dashboards & Alerts: Build dashboards for visual insights and configure alerts for real-time monitoring.
  • Advanced Features: Use machine learning for threat detection and integrate with other tools like SOAR.
  • Compliance & Reporting: Ensure regulatory compliance (e.g., NIST SP 800-53) and create actionable reports for stakeholders.
  • Certifications: Boost your career with certifications like Splunk Certified Cybersecurity Defense Analyst.

Splunk’s tools and features enable SOC teams to detect, investigate, and respond to threats efficiently. Start with the free version to practice and build expertise.

Want to Be a SOC Analyst? Master Splunk ES with This FREE Training Tool!

Splunk

sbb-itb-bf7aa6b

Splunk Basics for SOC Operations

Splunk Architecture Components and Data Flow for SOC Operations

Splunk Architecture Components and Data Flow for SOC Operations

Splunk Architecture and Core Components

Splunk’s architecture is built around three key tiers that work together to gather, process, and analyze security data. Here’s how it breaks down:

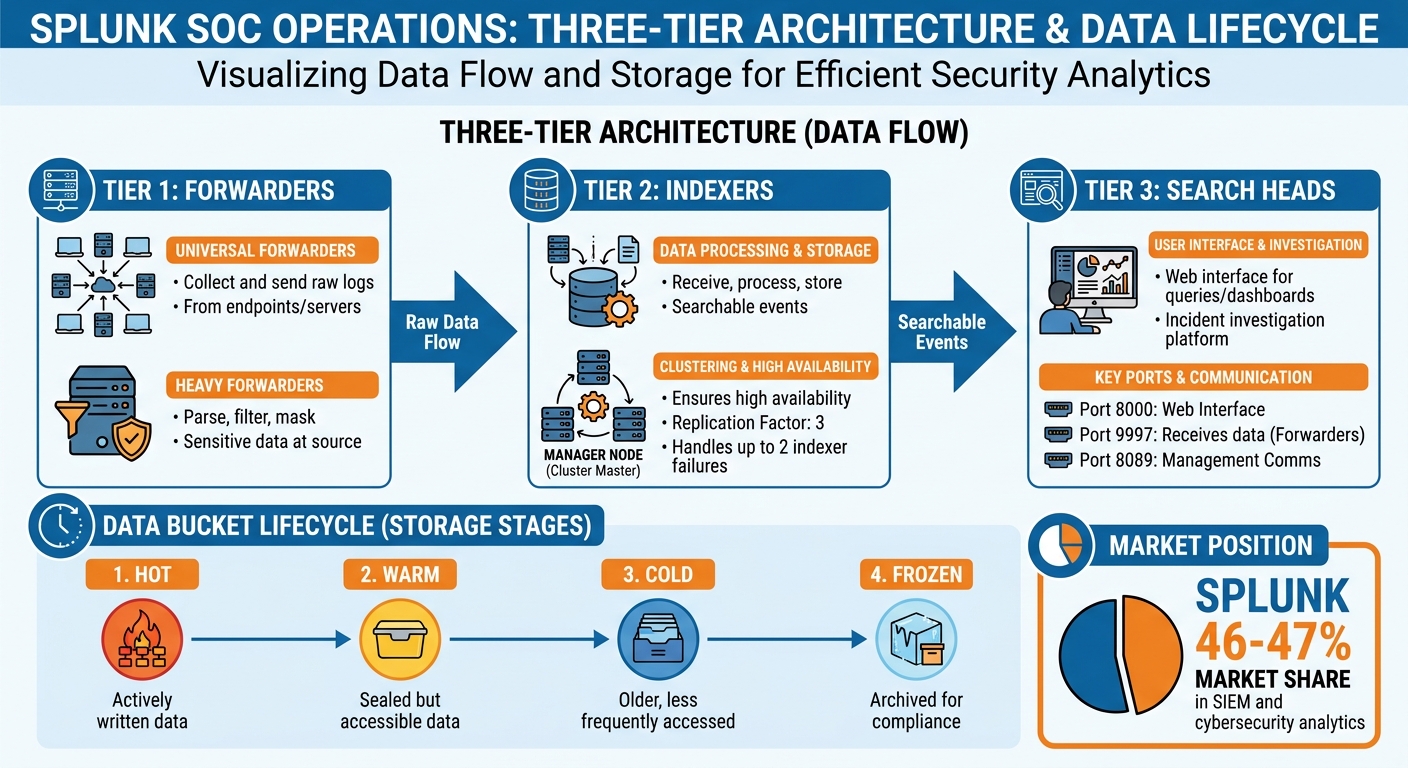
  • Forwarders: These are installed on endpoints and servers to collect logs and send them to the central system. Universal Forwarders handle raw data, while Heavy Forwarders can parse, filter, and mask sensitive information directly at the source.
  • Indexers: They receive, process, and store data as searchable events, making it accessible for analysis.
  • Search Heads: This is the web interface where you run queries, create dashboards, and investigate incidents.

For managing indexer clusters, the Manager Node (also known as the Cluster Master) ensures high availability. With a replication factor of 3, the system can handle up to two indexer failures without losing data or search functionality [5]. This level of redundancy is crucial for SOC environments where uninterrupted data access is critical. It’s worth noting that Splunk holds a dominant position in the SIEM and cybersecurity analytics market, commanding around 46–47% of the share [4].

Splunk processes data through different stages, known as buckets:

  • Hot: Actively written data.
  • Warm: Data that has been sealed but is still accessible.
  • Cold: Older, less frequently accessed data.
  • Frozen: Archived data, often stored for compliance.

Configuring frozen buckets during index creation is essential for meeting regulatory requirements. Additionally, the License Manager tracks daily data ingestion, helping organizations manage costs and plan capacity effectively.

Installing and Configuring Splunk

Splunk is compatible with Linux, Windows, and Kubernetes-based POD deployments. For production environments, it’s recommended to use Ubuntu Server with at least 4GB of RAM (8GB preferred), 4 CPU cores, and 20GB of free disk space. For beginners or small-scale labs, the free version supports up to 500MB of data ingestion per day, making it a great option for learning.

Once installed, enable automatic startup on Linux systems with:

sudo /opt/splunk/bin/splunk enable boot-start 

This ensures Splunk services restart automatically after a system reboot. To access the web interface, navigate to http://localhost:8000 or use your server’s IP address. Splunk requires configuration of three key ports:

  • Port 8000: Splunk Web interface.
  • Port 9997: For receiving data from Universal Forwarders.
  • Port 8089: For management communications.

Before deploying forwarders across your network, make sure to enable receiving on your main Splunk instance through Settings > Forwarding and receiving. For environments running Splunk Enterprise Security (ES), specific indexes like notable (security findings), risk (risk modifiers), and threat_activity (threat matches) should be configured [7].

Advanced settings are managed through .conf files such as indexes.conf and props.conf, which follow a specific precedence order depending on their directory location [6]. If you’re setting up a SOC lab in VirtualBox, take a "Clean" snapshot of the operating system before installing Splunk. This allows you to quickly restore the system in case of configuration issues [3].

Once installed and configured, you’re ready to dive into Splunk’s interface and start optimizing SOC operations.

Using the Splunk Interface

The Splunk interface is designed to make investigations efficient and intuitive. At its core is the Search Bar, where you run SPL (Search Processing Language) queries. The Search Assistant helps by offering autocomplete suggestions and displaying "Matching Searches" to recall past queries. Use the Time Range Picker to narrow your search to specific time periods, such as the last 24 hours or a custom date range.

The Timeline visualizes event distribution over time, making it easier to spot unusual activity or spikes that might indicate incidents. On the right, the Fields Sidebar automatically extracts key name-value pairs and organizes them into:

  • Selected fields: Visible in your results.
  • Interesting fields: Hidden by default but available for filtering.

Security analysts often work with fields like clientip, signatureID, and user to quickly filter and analyze data.

As your investigation progresses, you can switch between tabs like:

  • Events: Displays raw logs with your search terms highlighted. You can toggle between List and Table views for easier comparison of fields.
  • Patterns: Identifies recurring data patterns.
  • Statistics: Provides numerical summaries.
  • Visualization: Offers graphical representations of your search results.

The Activity Menu is another handy feature, giving access to Triggered Alerts and the Jobs Manager for monitoring long-running searches. Meanwhile, the Apps Dropdown lets you switch between the standard Search & Reporting interface and specialized tools like Splunk Enterprise Security or Splunk SOAR.

With its user-friendly tools and powerful features, the Splunk interface is a central hub for SOC operations, making it easier to manage and analyze security data efficiently.

Core Splunk Skills for Cleared SOC Analysts

Learning Splunk Search Processing Language (SPL)

For any SOC analyst, becoming proficient in Splunk Search Processing Language (SPL) is a game-changer. SPL is the backbone of Splunk investigations, blending elements of SQL and shell scripting to analyze security data effectively [8]. Most analysts get comfortable with SPL in just a couple of months, though full mastery typically takes up to a year [2].

Start every query with index= and sourcetype= – this simple habit drastically improves search speed. For example, instead of searching for "EventCode=4625" across the entire dataset, specifying metadata upfront narrows the scope and saves time [2]. Commands like stats and timechart are especially useful for summarizing data and spotting trends, as covered earlier [2].

SPL also offers powerful tools for customizing searches. The eval command helps create calculated fields or apply conditional logic, such as flagging accounts as "CRITICAL." When working with non-standard logs, rex can extract specific data using regular expressions, while lookup integrates external data sources like threat intelligence feeds to enrich your searches [2].

"The faster you can write queries, the faster you can respond to threats." – EpicDetect [2]

To optimize performance, always filter early in the search pipeline and avoid wildcards at the beginning of terms (e.g., *admin). Testing new queries with | head 100 is another smart way to preview results without overloading the system. And here’s a bonus tip: the free version of Splunk includes all the core SPL functionality, making it perfect for practice before diving into production environments [2].

Building Dashboards and Visualizations

Dashboards are where raw data transforms into actionable insights. They let you visualize your security posture at a glance. You can create dashboards by saving searches as panels or using the Dashboards page [28, 32]. Splunk offers two frameworks for building dashboards: Classic (Simple XML) for basic layouts and Dashboard Studio for more advanced, customizable designs [28, 33].

Each dashboard is made up of panels, which can be linked to a shared time picker using tokens. This allows you to adjust the time range for all panels simultaneously – a handy feature for investigating incidents across multiple data sources [10]. Drilldown functionality takes it a step further, letting you click on visualizations to dive deeper into raw events or related dashboards. For example, clicking on a spike in failed logins could reveal which accounts and IPs are involved [31, 35].

In cleared environments, controlling access to sensitive data is crucial. You can set dashboard permissions to Private, App-specific, or Global depending on your needs [9]. To keep dashboards focused, enable options like "hide element when data is unavailable", ensuring you only see information relevant to active threats [11]. Scheduled reports for panels can also help avoid exceeding search limits during busy times. If you’re using Dashboard Studio, remember that the default canvas size is 1920×1080 pixels, but you can adjust it to fit your SOC’s monitor setup [11].

With dashboards providing clarity, the next step is to configure alerts for real-time monitoring.

Setting Up Alerts and Real-Time Monitoring

Alerts are your early warning system, designed to detect threats as they happen. Splunk supports two types of alerts: real-time and scheduled. Real-time alerts monitor events as they’re indexed, while scheduled alerts run at specific intervals (e.g., hourly or via a cron schedule) [37, 39]. While real-time alerts offer immediate notifications, they can be resource-intensive. Scheduled alerts are often a better option for maintaining system performance [37, 40].

Set clear trigger conditions and use throttling to avoid overwhelming your team with unnecessary notifications. For critical threats, per-result triggering ensures every matching event prompts an action [13]. Rolling windows are another useful feature, allowing you to spot patterns like multiple privilege escalations within a short time frame [13].

To keep your Triggered Alerts page manageable during incidents, set an appropriate lifespan for alert records [37, 40]. In high-availability setups, it’s worth noting that real-time searches may not signal when a peer goes offline, making scheduled alerts more reliable for mission-critical tasks [37, 40].

Keep an eye on search performance using the Cloud Monitoring Console (CMC). This tool helps identify long-running or resource-heavy searches that could slow down your SOC operations [12]. When setting up alerts, make sure your base search includes all necessary fields, as trigger conditions only filter results – they don’t determine what data is available for alert actions.

Alert Type Best Use Case Resource Impact
Scheduled Compliance reporting, trend analysis Lower; runs only at specified times [37, 40]
Real-time Critical breaches, system failures Higher; requires continuous computation [37, 40]

Advanced Splunk Features for SOC Analysts

Once you’ve mastered the basics, diving into Splunk’s advanced features can help SOC analysts address more complex and stealthy threats.

Applying Machine Learning for Threat Detection

Splunk leverages machine learning to uncover threats that traditional rule-based systems might miss. The Machine Learning Toolkit (MLTK), which replaced the older Extreme Search engine, offers access to over 300 open-source algorithms through the Python for Scientific Computing Library [18]. This toolkit is particularly effective at identifying subtle threats, such as slow data exfiltration or new forms of advanced persistent threats [42,44].

Here’s how it works: the toolkit analyzes patterns in your environment to establish a baseline of normal behavior, flagging deviations. For instance, you could train a model to monitor login activity over a 30-day period. If a user suddenly logs in at 3:00 AM from an unusual location, the system can alert you [15]. Splunk organizes its models into two categories – streaming models for real-time analysis (24 hours) and batch models for historical data (30+ days) – to suit different types of threats [16].

A good starting point is the DensityFunction algorithm, which pinpoints outliers by identifying the least likely 1% of data based on numeric metrics like bytes transferred or failed login attempts [15]. Using commands like fit, apply, and score, you can train models, apply them to new data, and validate their accuracy [17]. To keep your models relevant, schedule weekly retraining via "Model Generation" searches as your environment evolves [42,43].

"Splunk learns what normal looks like for your organization and alerts you when something is way off." – Guillaume Pierre Fransen, AI/ML Specialist, Splunk [14]

By default, Splunk categorizes alerts as "high" if they fall in the top 5% probability tail and "extreme" if they are in the top 1% [14]. If alerts generate too much noise, you can adjust the threshold parameter in the apply command from 0.01 to 0.005 [15]. Keep in mind, machine learning anomalies are just the starting point – combine them with risk-based alerting to confirm whether an entity shows multiple suspicious behaviors before escalating [14].

Using Splunk for Incident Response and Forensics

Splunk isn’t just about detecting anomalies – it also excels at streamlining incident investigations. The Investigation Workbench within Splunk Enterprise Security centralizes all incident artifacts, such as assets, identities, files, and URLs, into a single view. This allows analysts to trace attack vectors without switching between tools [47,50]. The process follows a five-step workflow: review events, assess and triage, determine risk, mitigate, and re-assess [19].

The investigation bar in ES dashboards lets you conduct quick searches and add events to your case without disrupting your workflow [19]. To kick off your investigation, the | metadata type=sourcetypes command can help you quickly identify data sources and their time ranges [21]. For environments requiring thorough documentation, you can upload forensic files (like packet captures or screenshots) and maintain detailed analyst notes – up to 10,000 characters per note [47,48].

When prioritizing incidents, follow NIST’s framework by evaluating business, functional, and informational impacts, along with recoverability [19]. Splunk Mission Control provides response templates to ensure analysts complete all necessary tasks for specific incident types, whether it’s ransomware or insider threats [20]. Adding context through the Assets and Identities framework can also shape your response – knowing which department owns a compromised system can make a big difference [21].

Connecting Splunk with Other Security Tools

Splunk’s integration capabilities amplify its effectiveness. The Common Information Model (CIM) standardizes diverse data sources and aligns with the Open Cybersecurity Schema Framework (OCSF) for seamless vendor-neutral data sharing [1]. Pair Splunk with SOAR to automate responses by mapping CIM fields to the Common Event Format (CEF) [1]. For better security and auditability, create a specific service account (like splunk_automation) instead of using generic accounts [1].

The Splunk App for SOAR Export allows you to assign container labels to match specific playbooks, triggering automated actions when critical alerts occur [1]. In Mission Control, intelligence workflows act as no-code pipelines that extract and share indicators of compromise from up to 10 threat feeds. You can prioritize high-confidence indicators by assigning source weights (1 to 5, with 5 being the most trusted) and use safelist libraries to filter out known-good IPs or domains [1].

To avoid overwhelming your system, schedule event-forwarding searches every minute rather than running them in real time. And for production environments, always use valid SSL certificates signed by a Certificate Authority to secure connections [1].

Compliance, Reporting, and Career Growth

Meeting Regulatory Standards with Splunk

Ensuring compliance is a cornerstone of operating in cleared environments. To align Splunk Enterprise with regulatory requirements, you’ll need to configure it properly. Start by adding SPLUNK_FIPS=1 to the splunk-launch.conf file and running your operating system in FIPS mode [53,58]. If you encounter issues with RSA private keys in this mode, convert them from PEM to PKCS#8 [23].

Splunk helps meet NIST SP 800-53 rev5 standards by offering near real-time visibility into audit events, system components, and user activity. You can set up real-time alerts for events like log clearing or write failures and use an optional data integrity feature with SHA-256 hashing to ensure indexed data hasn’t been altered [22]. Keep in mind, though, that NIST will transition the FIPS 140-2 standard to its historical list on September 21, 2026, and will stop accepting new module validations after this date [53,55,56].

For FIPS compliance, ensure all apps in your environment are certified and avoid outdated algorithms like MD5, RC4, SHA1, or 3DES [58,59]. Instead, use secure alternatives like AES and ensure all communications rely on TLS 1.2 or higher [53,57]. Similarly, for Common Criteria (CCRA) compliance, your environment must operate on a CCRA-compliant OS and use a version of Splunk Enterprise that meets the required Target of Evaluation (TOE) [53,56].

Once compliance is established, the focus shifts to delivering insights that cleared stakeholders can act on.

Creating Reports for Cleared Stakeholders

Actionable reports are essential for cleared stakeholders. Using the Common Information Model (CIM) to normalize data ensures consistency across diverse sources [61,64]. To streamline reporting, schedule automated email updates with time range pickers and provide export options in formats like JSON, STIX, TXT, or PDF [60,62,63].

When sharing intelligence across enclaves or organizations, utilize redaction tools to remove sensitive details such as usernames or internal IP addresses [24]. Also, consider converting inline-search-powered dashboard panels into reports. This adjustment enables report acceleration and ensures results reflect the latest scheduled run [60,63]. These practices enhance the ability of SOC analysts to detect and respond to threats effectively.

To prevent confusion, give each report a clear and descriptive title, especially when working with federated search syntax [60,63].

Splunk Certifications for Cleared SOC Analysts

Certifications can significantly boost your career in cleared SOC operations, especially as you build expertise in compliance and reporting. The Splunk Certified Cybersecurity Defense Analyst (SCDA) credential is a key certification for SOC analysts, verifying skills in threat hunting, risk-based alerting, and leveraging Splunk analytics to combat cyber threats [67,69]. The SCDA exam includes 66 multiple-choice questions, must be completed in 75 minutes, and costs $130 USD per attempt [26]. Before tackling this certification, it’s wise to first earn the Splunk Core Certified Power User credential, which focuses on advanced search techniques essential for cleared environments [28].

For those managing Splunk Enterprise Security (ES) SIEM, the Splunk Enterprise Security Certified Admin certification is particularly relevant. This certification covers threat intelligence and event normalization. It’s a 60-minute test with 48 questions, also priced at $130 USD per attempt [27].

If you’re looking to specialize further, consider certifications such as the Splunk Certified Cybersecurity Defense Engineer for detection engineering or the Splunk SOAR Certified Automation Developer for incident response and playbook automation [66,69].

Certification Level Primary Focus Exam Details
Cybersecurity Defense Analyst Intermediate Threat hunting, risk-based alerting, analytics 66 questions, 75 minutes, $130 USD [26]
Enterprise Security Admin Professional SIEM management, threat intelligence, normalization 48 questions, 60 minutes, $130 USD [27]
Cybersecurity Defense Engineer Advanced Detection tuning, automation, threat intel development Advanced-level [25]
SOAR Automation Developer Specialist Playbook design, custom coding, orchestration Specialist-level [25]

To maintain compliance, regularly check updates on NIST and NIAP websites. Running Splunk in FIPS mode on a CCRA-compliant OS is generally required [29]. Additionally, Splunk is preparing to meet FIPS 140-3 standards before the September 2026 deadline, ensuring continued support for government and cleared customers [29].

Conclusion

Main Points from This Guide

Splunk stands out as the go-to SIEM platform for cleared SOC operations, helping teams collect, index, and search logs from thousands of devices [3]. To get the most out of it, mastering Search Processing Language (SPL) is a must. SPL is your key to investigating alerts, hunting threats, and creating detailed incident reports [2]. Focusing on core SPL patterns through consistent practice will yield better results than spreading your efforts too thin [2].

Take your skills further by exploring machine learning features, real-time alerting, and integrating security tools. When running searches, always optimize by starting with index= and sourcetype= to reduce system strain and speed up query results [2].

"The home lab is where careers are built. Not the certifications alone. Not the courses alone. The hours you spend inside a SIEM… that’s the experience that shows up in interviews." – Shewag Bhattarai [3]

These strategies provide a clear path for taking action and sharpening your skills.

Your Next Steps with Splunk

Start by setting up a home lab using Splunk Enterprise’s free tier, which allows up to 500MB of data ingestion per day [3]. Use VirtualBox to create a virtual machine running Ubuntu Server, install Splunk, and practice with the "Boss of the SOC" (BOTS) dataset to simulate real-world attack scenarios [3]. Dedicate just 15 minutes a day to writing SPL queries until the syntax feels natural [2].

Keep your skills up to date by regularly updating the Splunk Enterprise Security Content Update (ESCU) add-on. This ensures access to the latest "Analytic Stories" and detections from the Splunk Security Research team [30]. When you’re ready, explore roles in government and defense by checking out Cleared Cyber Security Jobs to put your expertise to work.

With these tools and strategies, you’re well-equipped to enhance your SOC operations and meet the evolving demands of cleared SOC roles.

FAQs

What logs should I onboard first in a cleared SOC Splunk deployment?

When setting up enterprise security, begin by focusing on security-related logs, such as Windows Event Logs and other key telemetry sources. Properly configuring these logs is crucial to ensure they are correctly ingested and normalized for analysis.

Make sure to include logs from a variety of sources, including:

  • Endpoints: Capture activity logs from user devices to monitor for potential threats or anomalies.
  • Servers: Track server logs to detect unauthorized access, system errors, or unusual behavior.
  • Network Devices: Incorporate logs from firewalls, routers, and switches to identify suspicious network activity.

By pulling data from these sources, you’ll significantly improve your ability to detect and analyze threats. Keep in mind that environments requiring high levels of security and compliance – such as cleared environments – demand extra care in handling sensitive information. Always align your log configurations with these compliance requirements to maintain data integrity and security.

How do I write fast SPL searches without overloading Splunk?

To keep your Splunk searches running smoothly and efficiently, focus on narrowing your data scope and applying smart query techniques. Here are a few strategies to help:

  • Define specific time ranges: Use commands like earliest=-24h latest=now to limit the search window and avoid scanning unnecessary data.
  • Filter data early: Apply precise criteria right at the start of your query to reduce the volume of data Splunk needs to process.
  • Leverage indexed fields: Stick to indexed fields whenever possible, and avoid wildcard searches that can slow things down.
  • Simplify complex searches: Break down intricate queries into smaller, manageable parts, or consider using summary indexing to pre-process data.

By following these tips, you can speed up your searches while minimizing the load on your Splunk environment.

When should I use scheduled alerts instead of real-time alerts?

When you need to run checks at set intervals – like daily or weekly – scheduled alerts are your go-to. These work well for tasks like routine reports or periodic analysis where getting instant updates isn’t a priority.

For situations that demand immediate action, though, real-time alerts are the better choice. They’re designed to notify you instantly about urgent security events, so you can respond to threats as they unfold.

Related Blog Posts

  • Splunk Certification Career Guide for Cleared SIEM Analysts
  • SOC Analyst Career Path for Cleared Professionals Tier 1 to Lead
  • Cleared SOC Analyst Jobs Complete Career Guide
  • Cleared Blue Team Jobs Complete Career Guide

1721 Cyberspace Officer USMC to Cleared Civilian Career Guide

CyberSecJobs Editorial · April 24, 2026 ·

As a 1721 Cyberspace Officer in the Marine Corps, you’ve gained unmatched hands-on experience in cybersecurity, including threat analysis, incident response, and vulnerability management. With over 700,000 cybersecurity jobs expected to remain unfilled in the U.S. by 2025, your skills, combined with an active TS/SCI clearance, position you as a top candidate for high-paying civilian roles. Transitioning successfully involves:

  • Translating military experience into civilian-friendly language (e.g., "classified/unclassified networks" instead of "NIPR/SIPR").
  • Earning certifications like CISSP, OSCP, or CCSP to maximize earning potential.
  • Highlighting your clearance prominently on your resume, as it can add $15,000-$30,000 to your salary.
  • Starting your job search early (12 months before separation) and leveraging programs like SkillBridge.

The cleared job market offers roles such as Threat Intelligence Analyst, Penetration Tester, and Security Architect, with salaries ranging from $95,000 to $250,000 depending on experience and certifications. Protecting your clearance, networking strategically, and tailoring your resume are key steps toward securing a rewarding career in cybersecurity.

What 1721 Cyberspace Officers Do and How It Applies to Civilian Jobs

Main Duties of 1721 Cyberspace Officers

As a 1721 Cyberspace Officer, your work revolves around threat analysis, incident response, and vulnerability management – all of which are crucial in both military and civilian cybersecurity roles. You’re responsible for monitoring security alerts across enterprise networks, investigating breaches, and researching threat actors to create intelligence reports that guide defensive strategies. When a security incident occurs, you take charge of containing the breach, conducting forensic analysis, and preparing detailed after-action reports.

In terms of vulnerability management, you use tools like ACAS (Tenable Nessus) to perform scans, analyze the results, and prioritize fixes according to DISA STIGs. Unlike many civilian professionals who often train in controlled, simulated environments, you’ve worked on live networks where the stakes are higher – failure could compromise national security. As Brad Tachi, CEO of Best Military Resume, explains:

"Military cyber professionals have something that most civilian cybersecurity candidates don’t: real-world operational experience defending networks against actual threats, not just simulated ones." [3]

These responsibilities align closely with core civilian cybersecurity functions.

Converting Military Cybersecurity Skills to Civilian Job Titles

Your experience as a 1721 Cyberspace Officer can translate seamlessly into civilian roles such as Threat Intelligence Analyst, Incident Responder, SOC Manager, Vulnerability Analyst, Cybersecurity Engineer, Penetration Tester, Red Team Lead, Security Architect, or even CISO. These roles align with the operational expertise you’ve developed, making your skills highly relevant in the civilian cybersecurity workforce.

The demand for cybersecurity professionals is booming, with information security analyst roles alone expected to grow by 33% through 2033. This growth will create around 17,300 new positions annually [4]. Your military background – defined by operational discipline, strict adherence to procedures, and accountability – makes you particularly well-suited for high-pressure environments like Security Operations Centers, where uptime for critical systems is non-negotiable.

sbb-itb-bf7aa6b

Certifications That Matter for Civilian Cybersecurity Careers

Certifications You May Already Have from Military Service

If you’ve served as a 1721 Cyberspace Officer, chances are you already hold CompTIA Security+, a baseline requirement for DoD 8570/8140 IAT Level II positions. This certification alone can open doors to most entry-level cleared cybersecurity jobs, with potential salaries ranging from $55,000 to $75,000 within six months of leaving the military [5]. Additionally, some 1721s acquire the Certified Ethical Hacker (CEH) certification through military training programs, which showcases your expertise in offensive cybersecurity.

Your hands-on experience defending networks from real-world threats gives you a significant advantage when tackling advanced certification exams. As Mike McNelis of Training Camp points out:

"A certification cuts through that translation problem. When your resume says CompTIA Security+ or CISSP, a hiring manager immediately understands your knowledge base" [7].

Your familiarity with frameworks like the Risk Management Framework (RMF), NIST guidelines, and DISA STIGs provides a solid foundation for certifications that many civilian candidates find challenging. These qualifications not only validate your expertise but also prepare you for pursuing advanced certifications that can boost your career prospects in the cleared cybersecurity field.

Additional Certifications That Improve Your Job Prospects

For those aiming for senior cybersecurity roles, the CISSP (Certified Information Systems Security Professional) is a standout credential. It requires five years of relevant experience, which your military service often satisfies. The exam costs $749, but programs like Marine Corps COOL can cover this expense [1][6]. CISSP-certified professionals typically earn salaries exceeding $130,000 on average [6].

If you’re targeting cloud security roles, consider the CCSP (Certified Cloud Security Professional). Priced at $599, it’s increasingly important as more organizations shift to cloud-based infrastructures [1]. For those interested in penetration testing or red team positions, the OSCP (Offensive Security Certified Professional) is highly regarded by technical hiring managers. At $1,599, it’s a rigorous certification that includes a 24-hour hands-on hacking exam, making it more respected than the CEH [1][3]. For defensive operations, such as roles in Security Operations Centers, the CompTIA CySA+ ($392) is tailored for SOC Analyst Tier II and Incident Responder positions [1][5].

Combining these certifications with your active TS/SCI clearance significantly increases your value to employers. This clearance spares organizations the $5,000–$15,000 cost and lengthy 6–18 month process of clearance sponsorship [1][3]. In fact, this added value can translate into an annual salary premium of $15,000 to $30,000 [3][2][4].

How Military Cyber Experience Translates to Civilian Careers

How to Write Your Resume for Cleared Cybersecurity Jobs

Your resume is the key to transitioning from military service to a civilian cybersecurity career. The challenge isn’t whether you have the skills – it’s making sure hiring managers can quickly recognize them. With recruiters spending just six seconds on an initial scan [12], your resume needs to be clear, concise, and written in civilian terms.

Replacing Military Terms with Civilian Language

Civilian hiring managers often struggle to interpret military jargon. To stand out, translate your experience into terms they can easily understand.

"A civilian hiring manager cannot decode ‘0311 Sgt, 2/8, 2d MarDiv’ in six seconds. But ‘Operations Team Supervisor managing 13 personnel and $1.2M in equipment’ – that they understand immediately" [12].

Start by converting your job title into a civilian equivalent. For example:

  • If you were an O-3 (Captain), use titles like Project Manager or Operations Manager.
  • O-4s (Majors) might list roles like Senior Program Manager or Director.
  • For 1721 Cyberspace Officers, civilian roles could include Cybersecurity Manager, SOC Director, or Information Security Lead [2][3].

Next, rewrite technical terms to align with civilian language. For example:

  • Replace "NIPR/SIPR" with "unclassified and classified network environments."
  • Swap "COMSEC" for "encryption management" or "communications security."
  • Describe tools like ACAS as "vulnerability assessment tools (Tenable Nessus)" [2].

When listing accomplishments, follow the CAR method (Challenge, Action, Result) [8]. Instead of stating "Executed defensive cyber operations", say: "Reduced incident containment time by 20% by implementing automated threat detection across a 15,000-node enterprise network" [3]. Wherever possible, include metrics like network size, user base, or asset value [2][3].

For classified work, focus on scope and complexity while avoiding sensitive details. Use phrases like "multi-enclave network environment" or "15,000-node enterprise network" to describe scale without disclosing specifics [10][11].

Here’s a quick reference for translating military terms:

Military Term Civilian Translation
DCO (Defensive Cyber Operations) Network defense operations
ACAS / HBSS Vulnerability scanners (Nessus) / Endpoint security suites
RMF (Risk Management Framework) Security compliance and authorization
DISA STIGs Security hardening standards
Briefed Commander Presented strategic recommendations to executive leadership

Once you’ve translated your experience, shift focus to highlighting your clearance and technical expertise.

Showing Your Clearance and Technical Skills

Your security clearance is a major asset, often boosting salaries by $15,000 to $30,000 annually [2][3]. Make it easy for recruiters to spot by listing it in two places:

  1. Directly under your contact information in the resume header.
  2. In a dedicated "Clearance" section near the top.

Use precise language like: Active TS/SCI with CI Polygraph – Current. This ensures your resume surfaces in searches [10].

"I’ve talked to defense contractor recruiters who told me they literally search their ATS for ‘TS/SCI’ as their first filter before looking at anything else. If your clearance isn’t in a searchable text field on your resume – or if you’ve buried it on page two – you’re invisible to these recruiters" [10].

For certifications, list high-demand credentials such as CISSP, CASP+, or OSCP prominently in a "Certifications" section immediately after your clearance.

In your technical skills section, include tools and frameworks that match job descriptions. Examples include Splunk, Wireshark, Nessus, and frameworks like NIST and MITRE ATT&CK [2][3].

Finally, format your resume using civilian-friendly conventions:

  • Use "City, State" for locations (e.g., "Camp Lejeune, NC").
  • List dates as "Month Year to Month Year" (e.g., "March 2018 to June 2022") to ensure compatibility with Applicant Tracking Systems.
  • Aim for a two-page maximum when applying for corporate roles [8][9].

Finding and Landing Cleared Cybersecurity Jobs

Having an active security clearance doesn’t just make you eligible for in-demand roles – it also saves employers a lot of time and money. By cutting sponsorship costs by $5,000–$15,000 and bypassing the 6–18 months typically needed for background checks [3][14], your clearance becomes a powerful bargaining tool. To make the most of it, you’ll need to know where to look, who’s hiring, and how to connect with key players. With your polished resume and certifications ready, it’s time to zero in on the right employers and build meaningful connections.

How Security Clearance Affects Your Job Options

If you hold a TS/SCI clearance, you could see a salary bump of $15,000–$30,000, with some roles offering annual pay premiums of $20,000–$60,000 compared to positions without clearance requirements [3][14].

But clearances don’t last forever – they’re time-sensitive. After leaving federal service, they typically stay "active" for just two years [14]. If your clearance expires, contractors face reinvestigation costs ranging from $10,000 to $30,000 [14]. To avoid this, aim to secure a cleared role or participate in a SkillBridge internship within 90 days of leaving the military [14].

When negotiating pay, emphasize the value of your clearance. For example, you might say:
"My active clearance saves your company 12–18 months of waiting and over $20,000 in investigation costs. I believe this benefit should be reflected in my compensation" [14].

Next, focus on identifying the employers actively seeking cleared talent.

Major Employers Hiring for Cleared Cybersecurity Positions

Cleared cybersecurity roles are concentrated within three main types of employers: defense contractors, federal agencies, and commercial tech companies with government contracts.

  • Defense contractors are the largest employers of cleared professionals. Big names include Booz Allen Hamilton, Leidos, ManTech, SAIC, Raytheon, and Northrop Grumman [3].
  • Federal agencies also hire cleared candidates directly. Use USAJobs.gov for civilian federal roles, and check IntelligenceCareers.gov for positions with agencies like the CIA, DIA, NGA, and NRO [13].
  • Commercial tech companies with government contracts – such as Amazon (AWS), Microsoft, Google, CrowdStrike, and Palo Alto Networks – employ cleared professionals. Even financial giants like JPMorgan Chase, Bank of America, and Goldman Sachs maintain cleared cybersecurity teams [3].

Geography can influence your job search. Cleared job hubs include the DC/Maryland/Virginia (DMV) corridor, Tampa, Colorado Springs, San Diego, and Huntsville.

Building Connections in the Cleared Community

Once you’ve identified potential employers, the next step is networking. Building relationships within the cleared community can help you bypass automated hiring systems and connect directly with decision-makers. One effective strategy is reaching out to former military colleagues now employed at defense contractors [14]. A referral from someone inside the company can significantly improve your chances.

Specialized job boards, like ClearanceJobs.com, are an excellent resource for cleared professionals. Unlike general job boards, ClearanceJobs allows recruiters to find you based on your clearance level – even when you’re not actively applying [13][14].

"Your clearance is a golden ticket, but only if you put it where employers can find it. A clearance buried on page two of your resume or missing from your online profile is a clearance that is not working for you."

  • Brad Tachi, Navy Veteran & BMR Founder [13]

On LinkedIn, use Boolean search techniques to locate recruiters and hiring managers. For instance, search for "Cybersecurity Manager" + "TS/SCI" or "Secret clearance required" to find professionals actively hiring for cleared roles [13][14]. Engaging with posts from employees at your target companies – like Lockheed Martin or Booz Allen Hamilton – can also boost your visibility.

Joining professional organizations, such as ISSA or (ISC)², can open doors to networking events in major cleared job hubs [13]. Attending cleared job fairs in cities like Northern Virginia, San Diego, or Huntsville is another great way to connect with hiring teams face-to-face [13].

Finally, consider the DoD SkillBridge program, which allows you to intern with a cleared contractor during your last 180 days of military service while still receiving your military pay [14]. This hands-on experience often leads to full-time job offers, giving you a head start before you officially transition out of service.

Salary Expectations and Career Advancement

Security Clearance Salary Premium and Career Progression for Cleared Cybersecurity Professionals

Security Clearance Salary Premium and Career Progression for Cleared Cybersecurity Professionals

Transitioning from a 1721 Cyberspace Officer role can significantly boost your earning potential compared to entry-level cybersecurity positions. For those in cleared roles, the pay premium ranges between 20–40% [15][16]. Understanding the factors that influence salaries and how to maximize them is vital for building a rewarding and sustainable career.

What Cleared Cybersecurity Jobs Pay

In cybersecurity, obtaining a security clearance is one of the biggest factors affecting salary. A Secret clearance typically adds $10,000–$20,000 annually, while a TS/SCI clearance can increase pay by $30,000–$45,000 compared to non-cleared positions [15][16]. For those with a TS/SCI with Full Scope Polygraph, the premium jumps to $45,000–$65,000 per year. Over a 20-year career, this could mean an additional $900,000–$1.3 million in lifetime earnings [15][16].

Here’s a snapshot of mid-career salaries (3–7 years of experience):

  • Security Engineers: $110,000–$150,000
  • Penetration Testers: $102,000–$143,000
  • SOC Analysts (Tier 2/3): $95,000–$125,000 [15]

For senior roles (8+ years), salaries rise dramatically:

  • Zero Trust Architects: $185,000–$250,000
  • Cloud Security Architects: $175,000–$240,000
  • AI Security Engineers: $175,000–$230,000+ [15]

Geography also plays a role. While DC/Northern Virginia offers the highest average salary at $145,000, cities like San Antonio ($118,000) and Huntsville ($112,000) provide better purchasing power due to lower living costs [15][16]. When switching contractors, aim for a 15–20% salary increase – your active clearance gives you a competitive edge [15].

"The cleared market starts where commercial mid-range ends." – CyberSecJobs Editorial [15]

These figures highlight how advanced certifications and specialized skills can significantly enhance earning potential.

Certifications That Lead to Higher Positions and Pay

Certifications are a powerful way to increase your salary. The CISSP is widely recognized as the gold standard for senior roles, security architecture, and management tracks, often adding $15,000–$25,000 to your salary [15]. For penetration testers and technical experts, the OSCP carries a $10,000–$20,000 premium due to its challenging practical exam [15].

Cloud security certifications are increasingly valuable as government agencies migrate to secure cloud environments like GovCloud and IL5-6. Earning certifications such as the CCSP, AWS Certified Security Specialty, or Azure Security Engineer (AZ-500) can add $10,000–$20,000 to your base salary [15]. Meanwhile, the CISM is a strong choice for those pursuing security management roles, with salary boosts ranging from $12,000–$20,000 [15].

Specialized skills in Zero Trust Architecture and AI/ML Security command the highest premiums. Professionals with these skills often earn $20,000–$40,000 above standard roles, as the talent pool in these areas is extremely limited [15]. With federal mandates requiring all agencies to adopt Zero Trust frameworks, architects in this field are among the best-paid individual contributors [15][16].

Planning Your Career Path in Cleared Cybersecurity

Strategic planning is essential for long-term success in cleared cybersecurity roles. One key milestone is the "5-Year Clearance Cliff", a point where salaries increase sharply as you gain mission-specific knowledge and expertise [15]. By this stage, your familiarity with classified systems often outweighs technical skills in value, opening doors to senior roles and leadership opportunities.

Protect your clearance at all costs. An active clearance is critical to advancing your career. If you leave a cleared role, you have 24 months to reactivate your clearance without undergoing a full reinvestigation [17][4]. Allowing a TS/SCI clearance to lapse by taking a non-cleared position is a costly mistake for veterans [17][4].

"Letting a TS/SCI lapse because you took a non-cleared position is one of the most expensive mistakes a transitioning veteran can make." – Brad Tachi, CEO, Best Military Resume [17]

Additionally, use contract recompetes to your advantage. When a new contractor takes over a contract, they often prioritize retaining incumbent staff, giving you leverage to negotiate a 15–20% salary increase [15]. While contractors generally earn 15–40% more in base salary, federal employees at higher levels, like a GS-14 Step 5 in DC ($163,104), can out-earn contractors when factoring in benefits like the FERS pension, TSP matching, and healthcare [15].

Finally, stay on top of emerging skills. Around 10% of cybersecurity job listings now mention AI expertise [15], and major employers like Google, IBM, and the DoD are shifting toward skills-based hiring, placing more emphasis on certifications and technical ability over formal degrees [4]. With 514,000 cybersecurity job openings projected in 2026 and 26% of roles currently unfilled [16], the demand for skilled cleared professionals shows no signs of slowing down.

Conclusion

Your military cyber background gives you a distinct edge when transitioning to cleared civilian roles. The practical experience you’ve gained defending networks against real adversaries holds far greater weight than purely academic credentials[2][3]. Additionally, your active security clearance is a significant advantage that most civilian candidates simply don’t have.

To make the most of your experience, translate your military achievements into civilian-friendly language, and back them up with measurable results. Using the CAR method (Challenge, Action, Result) can help you showcase your accomplishments with specifics like uptime percentages, the number of users supported, or the scale of the networks you managed[8]. Certifications are another key piece: while foundational ones like Security+ can open doors, credentials like CySA+ or CISSP can elevate your profile even further.

This approach has been proven time and again.

"The cyber veterans I’ve seen transition most successfully are the ones who don’t settle for the first SOC analyst job offered to them. Your military experience puts you above entry-level." – Brad Tachi, CEO of Best Military Resume[3]

One critical reminder: protect your clearance. You have a 24-month window to reactivate it after separation, and letting a TS/SCI clearance lapse could be a costly mistake[4]. To set yourself up for success, start planning your transition 12–18 months before separating. Update your online presence, network actively, and focus on connecting with key defense contractors[3][2]. With over 514,000 cybersecurity jobs projected to open by 2026, the demand for skilled professionals like you remains high.

FAQs

Which 1721 skills translate best to civilian cyber jobs?

Key abilities in cybersecurity revolve around offensive and defensive operations, penetration testing, network defense, and malware analysis. Having expertise with tools such as Python, Linux, and SIEM systems is especially important for those pursuing civilian roles in this field.

How do I keep my TS/SCI active after separation?

To maintain your TS/SCI clearance after separation, it can remain inactive for up to 24 months. During this period, you’ll need sponsorship from an employer or contractor to reactivate it. If it isn’t reactivated within those 24 months, the clearance will expire, and you’ll need to undergo a new investigation. Taking action within this timeframe is crucial to avoid restarting the entire process.

What cert should I get next for my target role?

The best certification for you depends on where you are in your career and what role you’re aiming for. If you’re targeting advanced positions like a security engineer, the CISSP is a strong choice. For those just starting out or looking to establish a solid base, Security+ is a great starting point and is often a requirement for government or cleared positions. If penetration testing or offensive security is your goal, the CEH is worth considering. A smart progression might be earning Security+ first, then moving on to CISSP or CEH, depending on your career aspirations.

Related Blog Posts

  • Cyber Warfare Specialist Career Path for Cleared Military
  • Cleared Cyber Jobs at Coast Guard Cyber Command Complete Guide
  • CTN Cryptologic Technician Networks to Cleared Cyber Career Guide
  • 0651 Cyber Network Operator USMC to Cleared Civilian Career Guide

  • « Go to Previous Page
  • Go to page 1
  • Interim pages omitted …
  • Go to page 4
  • Go to page 5
  • Go to page 6
  • Go to page 7
  • Go to page 8
  • Interim pages omitted …
  • Go to page 21
  • Go to Next Page »
  • Facebook
  • Instagram
  • LinkedIn
  • Twitter
  • YouTube

Cleared Cyber Security Jobs | CyberSecJobs.com

  • Contact
  • About
  • Privacy Policy