

Splunk is a critical tool for SOC analysts working in cleared environments. It centralizes machine data, accelerates investigations, and supports threat hunting. This guide focuses on key skills, tools, and strategies to maximize Splunk‘s potential for security operations.
Key Takeaways:
- Splunk Basics: Learn about its architecture (Forwarders, Indexers, Search Heads) and data stages (Hot, Warm, Cold, Frozen).
- Search Processing Language (SPL): Master SPL queries for faster threat detection and analysis.
- Dashboards & Alerts: Build dashboards for visual insights and configure alerts for real-time monitoring.
- Advanced Features: Use machine learning for threat detection and integrate with other tools like SOAR.
- Compliance & Reporting: Ensure regulatory compliance (e.g., NIST SP 800-53) and create actionable reports for stakeholders.
- Certifications: Boost your career with certifications like Splunk Certified Cybersecurity Defense Analyst.
Splunk’s tools and features enable SOC teams to detect, investigate, and respond to threats efficiently. Start with the free version to practice and build expertise.
Want to Be a SOC Analyst? Master Splunk ES with This FREE Training Tool!
sbb-itb-bf7aa6b
Splunk Basics for SOC Operations
Splunk Architecture Components and Data Flow for SOC Operations
Splunk Architecture and Core Components
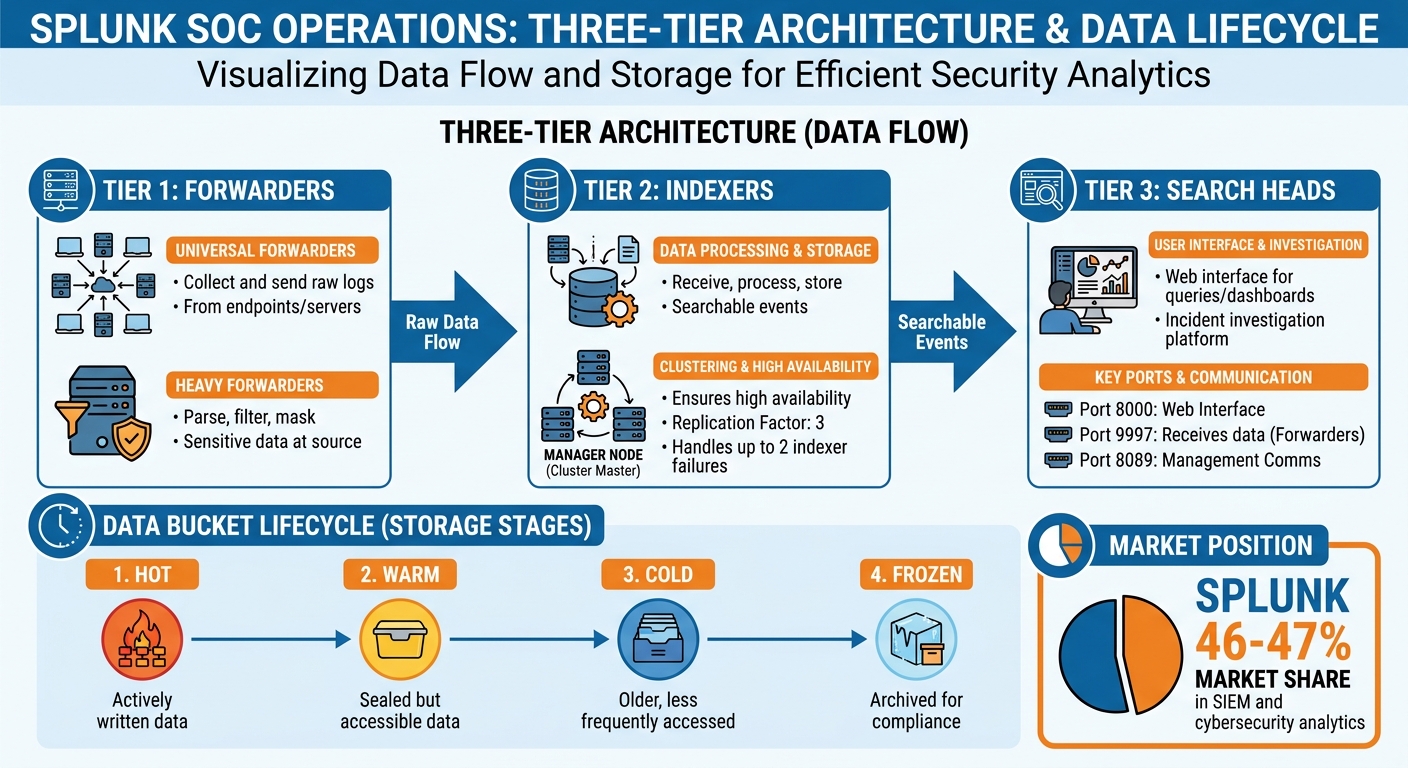
Splunk’s architecture is built around three key tiers that work together to gather, process, and analyze security data. Here’s how it breaks down:
- Forwarders: These are installed on endpoints and servers to collect logs and send them to the central system. Universal Forwarders handle raw data, while Heavy Forwarders can parse, filter, and mask sensitive information directly at the source.
- Indexers: They receive, process, and store data as searchable events, making it accessible for analysis.
- Search Heads: This is the web interface where you run queries, create dashboards, and investigate incidents.
For managing indexer clusters, the Manager Node (also known as the Cluster Master) ensures high availability. With a replication factor of 3, the system can handle up to two indexer failures without losing data or search functionality [5]. This level of redundancy is crucial for SOC environments where uninterrupted data access is critical. It’s worth noting that Splunk holds a dominant position in the SIEM and cybersecurity analytics market, commanding around 46–47% of the share [4].
Splunk processes data through different stages, known as buckets:
- Hot: Actively written data.
- Warm: Data that has been sealed but is still accessible.
- Cold: Older, less frequently accessed data.
- Frozen: Archived data, often stored for compliance.
Configuring frozen buckets during index creation is essential for meeting regulatory requirements. Additionally, the License Manager tracks daily data ingestion, helping organizations manage costs and plan capacity effectively.
Installing and Configuring Splunk
Splunk is compatible with Linux, Windows, and Kubernetes-based POD deployments. For production environments, it’s recommended to use Ubuntu Server with at least 4GB of RAM (8GB preferred), 4 CPU cores, and 20GB of free disk space. For beginners or small-scale labs, the free version supports up to 500MB of data ingestion per day, making it a great option for learning.
Once installed, enable automatic startup on Linux systems with:
sudo /opt/splunk/bin/splunk enable boot-start This ensures Splunk services restart automatically after a system reboot. To access the web interface, navigate to http://localhost:8000 or use your server’s IP address. Splunk requires configuration of three key ports:
- Port 8000: Splunk Web interface.
- Port 9997: For receiving data from Universal Forwarders.
- Port 8089: For management communications.
Before deploying forwarders across your network, make sure to enable receiving on your main Splunk instance through Settings > Forwarding and receiving. For environments running Splunk Enterprise Security (ES), specific indexes like notable (security findings), risk (risk modifiers), and threat_activity (threat matches) should be configured [7].
Advanced settings are managed through .conf files such as indexes.conf and props.conf, which follow a specific precedence order depending on their directory location [6]. If you’re setting up a SOC lab in VirtualBox, take a "Clean" snapshot of the operating system before installing Splunk. This allows you to quickly restore the system in case of configuration issues [3].
Once installed and configured, you’re ready to dive into Splunk’s interface and start optimizing SOC operations.
Using the Splunk Interface
The Splunk interface is designed to make investigations efficient and intuitive. At its core is the Search Bar, where you run SPL (Search Processing Language) queries. The Search Assistant helps by offering autocomplete suggestions and displaying "Matching Searches" to recall past queries. Use the Time Range Picker to narrow your search to specific time periods, such as the last 24 hours or a custom date range.
The Timeline visualizes event distribution over time, making it easier to spot unusual activity or spikes that might indicate incidents. On the right, the Fields Sidebar automatically extracts key name-value pairs and organizes them into:
- Selected fields: Visible in your results.
- Interesting fields: Hidden by default but available for filtering.
Security analysts often work with fields like clientip, signatureID, and user to quickly filter and analyze data.
As your investigation progresses, you can switch between tabs like:
- Events: Displays raw logs with your search terms highlighted. You can toggle between List and Table views for easier comparison of fields.
- Patterns: Identifies recurring data patterns.
- Statistics: Provides numerical summaries.
- Visualization: Offers graphical representations of your search results.
The Activity Menu is another handy feature, giving access to Triggered Alerts and the Jobs Manager for monitoring long-running searches. Meanwhile, the Apps Dropdown lets you switch between the standard Search & Reporting interface and specialized tools like Splunk Enterprise Security or Splunk SOAR.
With its user-friendly tools and powerful features, the Splunk interface is a central hub for SOC operations, making it easier to manage and analyze security data efficiently.
Core Splunk Skills for Cleared SOC Analysts
Learning Splunk Search Processing Language (SPL)
For any SOC analyst, becoming proficient in Splunk Search Processing Language (SPL) is a game-changer. SPL is the backbone of Splunk investigations, blending elements of SQL and shell scripting to analyze security data effectively [8]. Most analysts get comfortable with SPL in just a couple of months, though full mastery typically takes up to a year [2].
Start every query with index= and sourcetype= – this simple habit drastically improves search speed. For example, instead of searching for "EventCode=4625" across the entire dataset, specifying metadata upfront narrows the scope and saves time [2]. Commands like stats and timechart are especially useful for summarizing data and spotting trends, as covered earlier [2].
SPL also offers powerful tools for customizing searches. The eval command helps create calculated fields or apply conditional logic, such as flagging accounts as "CRITICAL." When working with non-standard logs, rex can extract specific data using regular expressions, while lookup integrates external data sources like threat intelligence feeds to enrich your searches [2].
"The faster you can write queries, the faster you can respond to threats." – EpicDetect [2]
To optimize performance, always filter early in the search pipeline and avoid wildcards at the beginning of terms (e.g., *admin). Testing new queries with | head 100 is another smart way to preview results without overloading the system. And here’s a bonus tip: the free version of Splunk includes all the core SPL functionality, making it perfect for practice before diving into production environments [2].
Building Dashboards and Visualizations
Dashboards are where raw data transforms into actionable insights. They let you visualize your security posture at a glance. You can create dashboards by saving searches as panels or using the Dashboards page [28, 32]. Splunk offers two frameworks for building dashboards: Classic (Simple XML) for basic layouts and Dashboard Studio for more advanced, customizable designs [28, 33].
Each dashboard is made up of panels, which can be linked to a shared time picker using tokens. This allows you to adjust the time range for all panels simultaneously – a handy feature for investigating incidents across multiple data sources [10]. Drilldown functionality takes it a step further, letting you click on visualizations to dive deeper into raw events or related dashboards. For example, clicking on a spike in failed logins could reveal which accounts and IPs are involved [31, 35].
In cleared environments, controlling access to sensitive data is crucial. You can set dashboard permissions to Private, App-specific, or Global depending on your needs [9]. To keep dashboards focused, enable options like "hide element when data is unavailable", ensuring you only see information relevant to active threats [11]. Scheduled reports for panels can also help avoid exceeding search limits during busy times. If you’re using Dashboard Studio, remember that the default canvas size is 1920×1080 pixels, but you can adjust it to fit your SOC’s monitor setup [11].
With dashboards providing clarity, the next step is to configure alerts for real-time monitoring.
Setting Up Alerts and Real-Time Monitoring
Alerts are your early warning system, designed to detect threats as they happen. Splunk supports two types of alerts: real-time and scheduled. Real-time alerts monitor events as they’re indexed, while scheduled alerts run at specific intervals (e.g., hourly or via a cron schedule) [37, 39]. While real-time alerts offer immediate notifications, they can be resource-intensive. Scheduled alerts are often a better option for maintaining system performance [37, 40].
Set clear trigger conditions and use throttling to avoid overwhelming your team with unnecessary notifications. For critical threats, per-result triggering ensures every matching event prompts an action [13]. Rolling windows are another useful feature, allowing you to spot patterns like multiple privilege escalations within a short time frame [13].
To keep your Triggered Alerts page manageable during incidents, set an appropriate lifespan for alert records [37, 40]. In high-availability setups, it’s worth noting that real-time searches may not signal when a peer goes offline, making scheduled alerts more reliable for mission-critical tasks [37, 40].
Keep an eye on search performance using the Cloud Monitoring Console (CMC). This tool helps identify long-running or resource-heavy searches that could slow down your SOC operations [12]. When setting up alerts, make sure your base search includes all necessary fields, as trigger conditions only filter results – they don’t determine what data is available for alert actions.
| Alert Type | Best Use Case | Resource Impact |
|---|---|---|
| Scheduled | Compliance reporting, trend analysis | Lower; runs only at specified times [37, 40] |
| Real-time | Critical breaches, system failures | Higher; requires continuous computation [37, 40] |
Advanced Splunk Features for SOC Analysts
Once you’ve mastered the basics, diving into Splunk’s advanced features can help SOC analysts address more complex and stealthy threats.
Applying Machine Learning for Threat Detection
Splunk leverages machine learning to uncover threats that traditional rule-based systems might miss. The Machine Learning Toolkit (MLTK), which replaced the older Extreme Search engine, offers access to over 300 open-source algorithms through the Python for Scientific Computing Library [18]. This toolkit is particularly effective at identifying subtle threats, such as slow data exfiltration or new forms of advanced persistent threats [42,44].
Here’s how it works: the toolkit analyzes patterns in your environment to establish a baseline of normal behavior, flagging deviations. For instance, you could train a model to monitor login activity over a 30-day period. If a user suddenly logs in at 3:00 AM from an unusual location, the system can alert you [15]. Splunk organizes its models into two categories – streaming models for real-time analysis (24 hours) and batch models for historical data (30+ days) – to suit different types of threats [16].
A good starting point is the DensityFunction algorithm, which pinpoints outliers by identifying the least likely 1% of data based on numeric metrics like bytes transferred or failed login attempts [15]. Using commands like fit, apply, and score, you can train models, apply them to new data, and validate their accuracy [17]. To keep your models relevant, schedule weekly retraining via "Model Generation" searches as your environment evolves [42,43].
"Splunk learns what normal looks like for your organization and alerts you when something is way off." – Guillaume Pierre Fransen, AI/ML Specialist, Splunk [14]
By default, Splunk categorizes alerts as "high" if they fall in the top 5% probability tail and "extreme" if they are in the top 1% [14]. If alerts generate too much noise, you can adjust the threshold parameter in the apply command from 0.01 to 0.005 [15]. Keep in mind, machine learning anomalies are just the starting point – combine them with risk-based alerting to confirm whether an entity shows multiple suspicious behaviors before escalating [14].
Using Splunk for Incident Response and Forensics
Splunk isn’t just about detecting anomalies – it also excels at streamlining incident investigations. The Investigation Workbench within Splunk Enterprise Security centralizes all incident artifacts, such as assets, identities, files, and URLs, into a single view. This allows analysts to trace attack vectors without switching between tools [47,50]. The process follows a five-step workflow: review events, assess and triage, determine risk, mitigate, and re-assess [19].
The investigation bar in ES dashboards lets you conduct quick searches and add events to your case without disrupting your workflow [19]. To kick off your investigation, the | metadata type=sourcetypes command can help you quickly identify data sources and their time ranges [21]. For environments requiring thorough documentation, you can upload forensic files (like packet captures or screenshots) and maintain detailed analyst notes – up to 10,000 characters per note [47,48].
When prioritizing incidents, follow NIST’s framework by evaluating business, functional, and informational impacts, along with recoverability [19]. Splunk Mission Control provides response templates to ensure analysts complete all necessary tasks for specific incident types, whether it’s ransomware or insider threats [20]. Adding context through the Assets and Identities framework can also shape your response – knowing which department owns a compromised system can make a big difference [21].
Connecting Splunk with Other Security Tools
Splunk’s integration capabilities amplify its effectiveness. The Common Information Model (CIM) standardizes diverse data sources and aligns with the Open Cybersecurity Schema Framework (OCSF) for seamless vendor-neutral data sharing [1]. Pair Splunk with SOAR to automate responses by mapping CIM fields to the Common Event Format (CEF) [1]. For better security and auditability, create a specific service account (like splunk_automation) instead of using generic accounts [1].
The Splunk App for SOAR Export allows you to assign container labels to match specific playbooks, triggering automated actions when critical alerts occur [1]. In Mission Control, intelligence workflows act as no-code pipelines that extract and share indicators of compromise from up to 10 threat feeds. You can prioritize high-confidence indicators by assigning source weights (1 to 5, with 5 being the most trusted) and use safelist libraries to filter out known-good IPs or domains [1].
To avoid overwhelming your system, schedule event-forwarding searches every minute rather than running them in real time. And for production environments, always use valid SSL certificates signed by a Certificate Authority to secure connections [1].
Compliance, Reporting, and Career Growth
Meeting Regulatory Standards with Splunk
Ensuring compliance is a cornerstone of operating in cleared environments. To align Splunk Enterprise with regulatory requirements, you’ll need to configure it properly. Start by adding SPLUNK_FIPS=1 to the splunk-launch.conf file and running your operating system in FIPS mode [53,58]. If you encounter issues with RSA private keys in this mode, convert them from PEM to PKCS#8 [23].
Splunk helps meet NIST SP 800-53 rev5 standards by offering near real-time visibility into audit events, system components, and user activity. You can set up real-time alerts for events like log clearing or write failures and use an optional data integrity feature with SHA-256 hashing to ensure indexed data hasn’t been altered [22]. Keep in mind, though, that NIST will transition the FIPS 140-2 standard to its historical list on September 21, 2026, and will stop accepting new module validations after this date [53,55,56].
For FIPS compliance, ensure all apps in your environment are certified and avoid outdated algorithms like MD5, RC4, SHA1, or 3DES [58,59]. Instead, use secure alternatives like AES and ensure all communications rely on TLS 1.2 or higher [53,57]. Similarly, for Common Criteria (CCRA) compliance, your environment must operate on a CCRA-compliant OS and use a version of Splunk Enterprise that meets the required Target of Evaluation (TOE) [53,56].
Once compliance is established, the focus shifts to delivering insights that cleared stakeholders can act on.
Creating Reports for Cleared Stakeholders
Actionable reports are essential for cleared stakeholders. Using the Common Information Model (CIM) to normalize data ensures consistency across diverse sources [61,64]. To streamline reporting, schedule automated email updates with time range pickers and provide export options in formats like JSON, STIX, TXT, or PDF [60,62,63].
When sharing intelligence across enclaves or organizations, utilize redaction tools to remove sensitive details such as usernames or internal IP addresses [24]. Also, consider converting inline-search-powered dashboard panels into reports. This adjustment enables report acceleration and ensures results reflect the latest scheduled run [60,63]. These practices enhance the ability of SOC analysts to detect and respond to threats effectively.
To prevent confusion, give each report a clear and descriptive title, especially when working with federated search syntax [60,63].
Splunk Certifications for Cleared SOC Analysts
Certifications can significantly boost your career in cleared SOC operations, especially as you build expertise in compliance and reporting. The Splunk Certified Cybersecurity Defense Analyst (SCDA) credential is a key certification for SOC analysts, verifying skills in threat hunting, risk-based alerting, and leveraging Splunk analytics to combat cyber threats [67,69]. The SCDA exam includes 66 multiple-choice questions, must be completed in 75 minutes, and costs $130 USD per attempt [26]. Before tackling this certification, it’s wise to first earn the Splunk Core Certified Power User credential, which focuses on advanced search techniques essential for cleared environments [28].
For those managing Splunk Enterprise Security (ES) SIEM, the Splunk Enterprise Security Certified Admin certification is particularly relevant. This certification covers threat intelligence and event normalization. It’s a 60-minute test with 48 questions, also priced at $130 USD per attempt [27].
If you’re looking to specialize further, consider certifications such as the Splunk Certified Cybersecurity Defense Engineer for detection engineering or the Splunk SOAR Certified Automation Developer for incident response and playbook automation [66,69].
| Certification | Level | Primary Focus | Exam Details |
|---|---|---|---|
| Cybersecurity Defense Analyst | Intermediate | Threat hunting, risk-based alerting, analytics | 66 questions, 75 minutes, $130 USD [26] |
| Enterprise Security Admin | Professional | SIEM management, threat intelligence, normalization | 48 questions, 60 minutes, $130 USD [27] |
| Cybersecurity Defense Engineer | Advanced | Detection tuning, automation, threat intel development | Advanced-level [25] |
| SOAR Automation Developer | Specialist | Playbook design, custom coding, orchestration | Specialist-level [25] |
To maintain compliance, regularly check updates on NIST and NIAP websites. Running Splunk in FIPS mode on a CCRA-compliant OS is generally required [29]. Additionally, Splunk is preparing to meet FIPS 140-3 standards before the September 2026 deadline, ensuring continued support for government and cleared customers [29].
Conclusion
Main Points from This Guide
Splunk stands out as the go-to SIEM platform for cleared SOC operations, helping teams collect, index, and search logs from thousands of devices [3]. To get the most out of it, mastering Search Processing Language (SPL) is a must. SPL is your key to investigating alerts, hunting threats, and creating detailed incident reports [2]. Focusing on core SPL patterns through consistent practice will yield better results than spreading your efforts too thin [2].
Take your skills further by exploring machine learning features, real-time alerting, and integrating security tools. When running searches, always optimize by starting with index= and sourcetype= to reduce system strain and speed up query results [2].
"The home lab is where careers are built. Not the certifications alone. Not the courses alone. The hours you spend inside a SIEM… that’s the experience that shows up in interviews." – Shewag Bhattarai [3]
These strategies provide a clear path for taking action and sharpening your skills.
Your Next Steps with Splunk
Start by setting up a home lab using Splunk Enterprise’s free tier, which allows up to 500MB of data ingestion per day [3]. Use VirtualBox to create a virtual machine running Ubuntu Server, install Splunk, and practice with the "Boss of the SOC" (BOTS) dataset to simulate real-world attack scenarios [3]. Dedicate just 15 minutes a day to writing SPL queries until the syntax feels natural [2].
Keep your skills up to date by regularly updating the Splunk Enterprise Security Content Update (ESCU) add-on. This ensures access to the latest "Analytic Stories" and detections from the Splunk Security Research team [30]. When you’re ready, explore roles in government and defense by checking out Cleared Cyber Security Jobs to put your expertise to work.
With these tools and strategies, you’re well-equipped to enhance your SOC operations and meet the evolving demands of cleared SOC roles.
FAQs
What logs should I onboard first in a cleared SOC Splunk deployment?
When setting up enterprise security, begin by focusing on security-related logs, such as Windows Event Logs and other key telemetry sources. Properly configuring these logs is crucial to ensure they are correctly ingested and normalized for analysis.
Make sure to include logs from a variety of sources, including:
- Endpoints: Capture activity logs from user devices to monitor for potential threats or anomalies.
- Servers: Track server logs to detect unauthorized access, system errors, or unusual behavior.
- Network Devices: Incorporate logs from firewalls, routers, and switches to identify suspicious network activity.
By pulling data from these sources, you’ll significantly improve your ability to detect and analyze threats. Keep in mind that environments requiring high levels of security and compliance – such as cleared environments – demand extra care in handling sensitive information. Always align your log configurations with these compliance requirements to maintain data integrity and security.
How do I write fast SPL searches without overloading Splunk?
To keep your Splunk searches running smoothly and efficiently, focus on narrowing your data scope and applying smart query techniques. Here are a few strategies to help:
- Define specific time ranges: Use commands like
earliest=-24h latest=nowto limit the search window and avoid scanning unnecessary data. - Filter data early: Apply precise criteria right at the start of your query to reduce the volume of data Splunk needs to process.
- Leverage indexed fields: Stick to indexed fields whenever possible, and avoid wildcard searches that can slow things down.
- Simplify complex searches: Break down intricate queries into smaller, manageable parts, or consider using summary indexing to pre-process data.
By following these tips, you can speed up your searches while minimizing the load on your Splunk environment.
When should I use scheduled alerts instead of real-time alerts?
When you need to run checks at set intervals – like daily or weekly – scheduled alerts are your go-to. These work well for tasks like routine reports or periodic analysis where getting instant updates isn’t a priority.
For situations that demand immediate action, though, real-time alerts are the better choice. They’re designed to notify you instantly about urgent security events, so you can respond to threats as they unfold.